Comparing the impacts of El Niño and Global Warming on Local Temperature/Rainfall
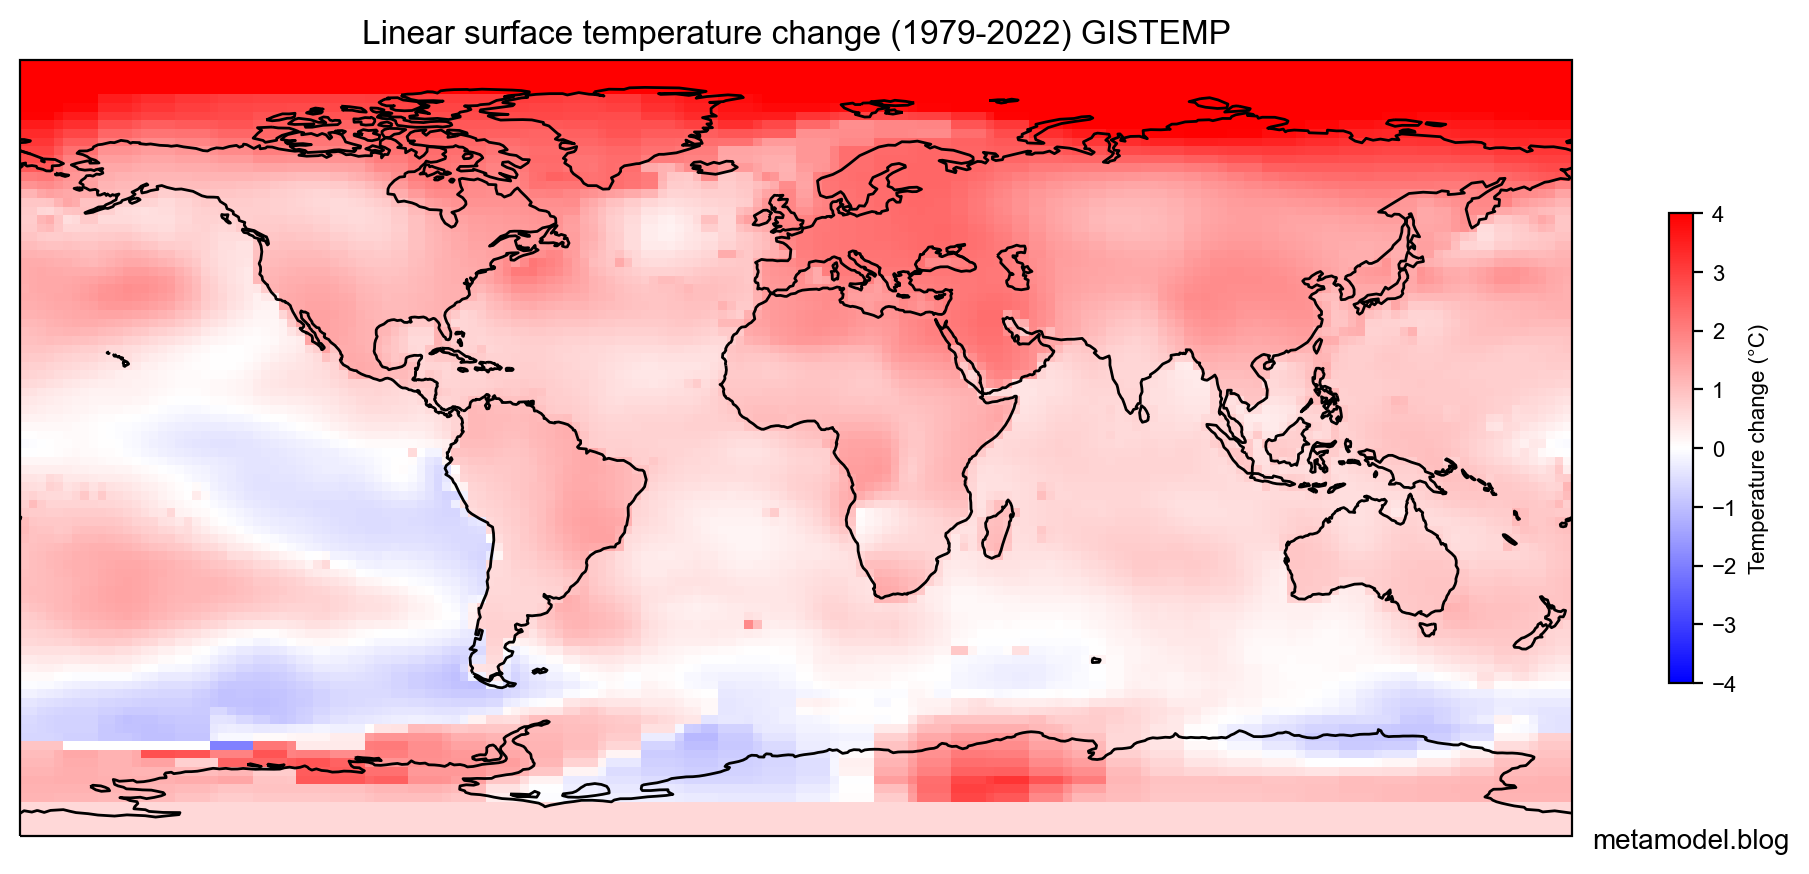
Global Warming Trend (not clickable)
All the plots below are clickable.
Click anywhere on the map to view local time series, along with the global warming trend and the
regression estimate of the impact of a 2σ El Niño event. Alternatively, enter latitude, longitude values in the box and use button+drop-down to generate overlay/inline plot. Click on any blank area of plot to make it go away.
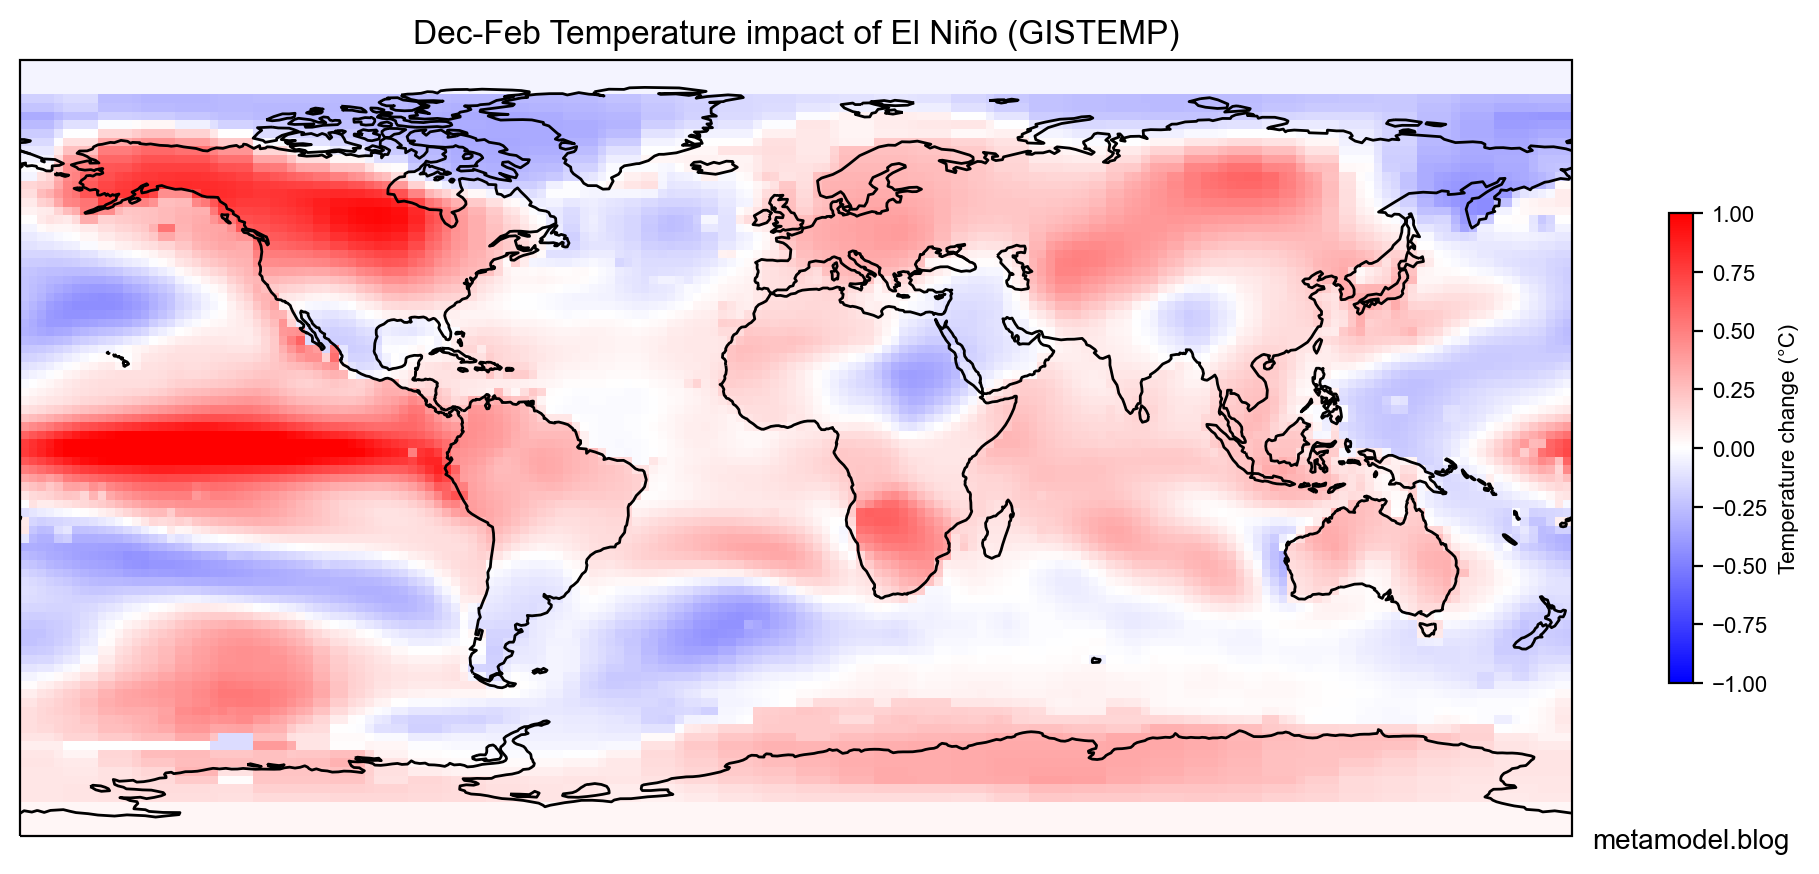
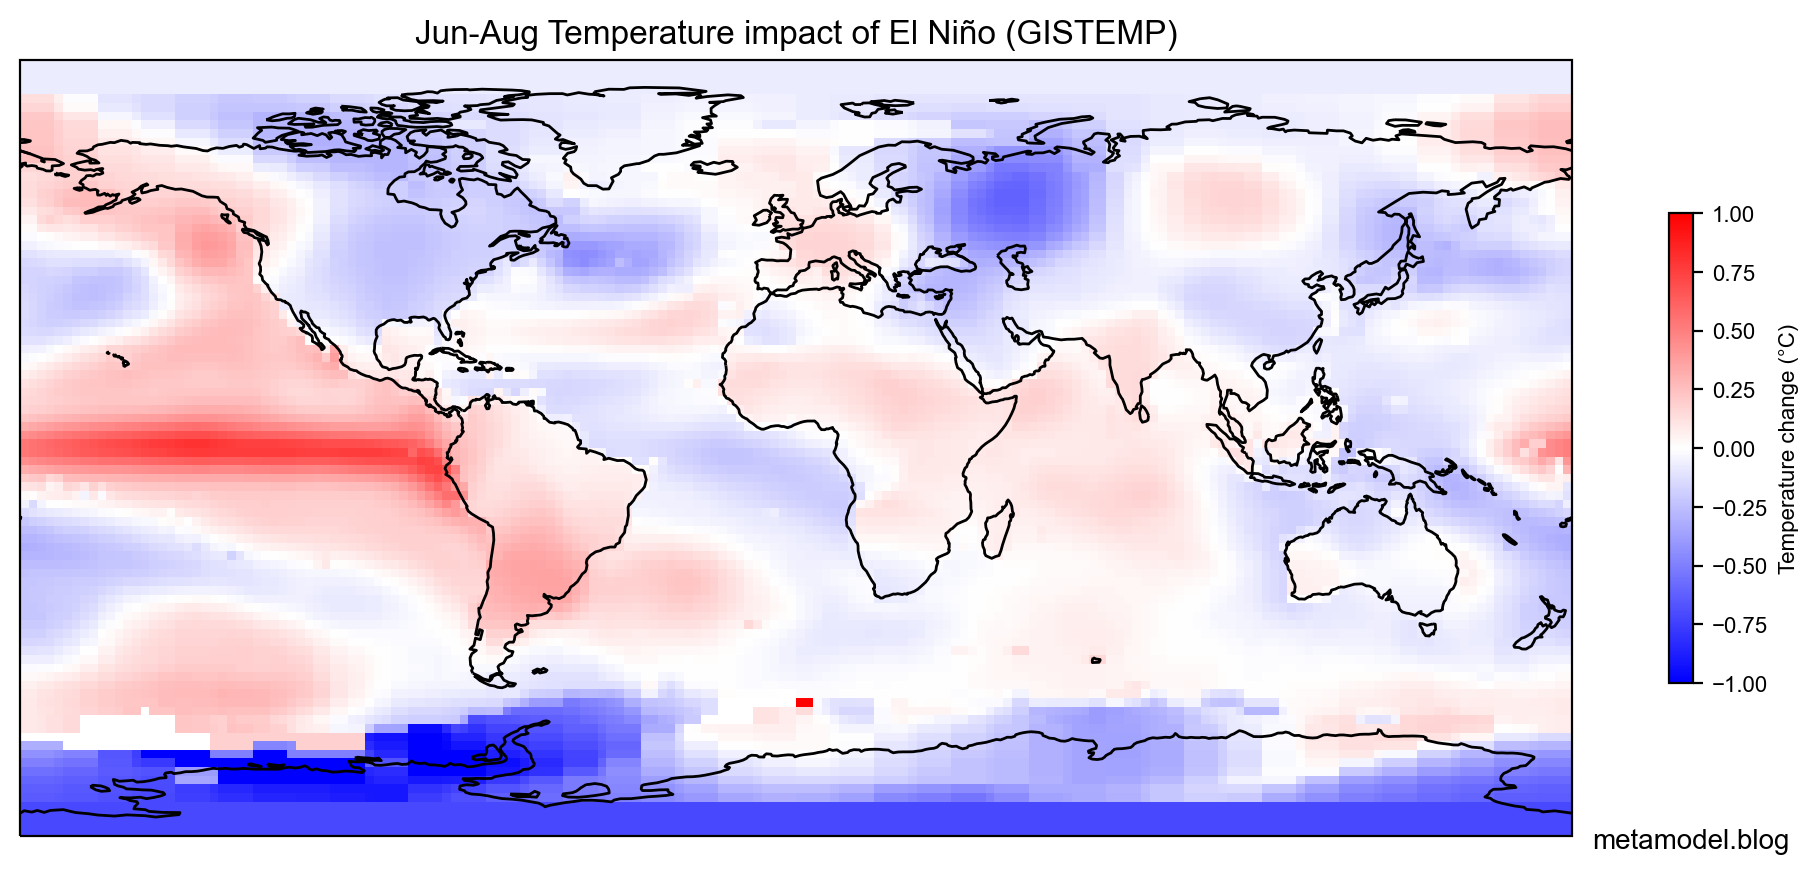
Temperature (GISTEMP4 dataset)
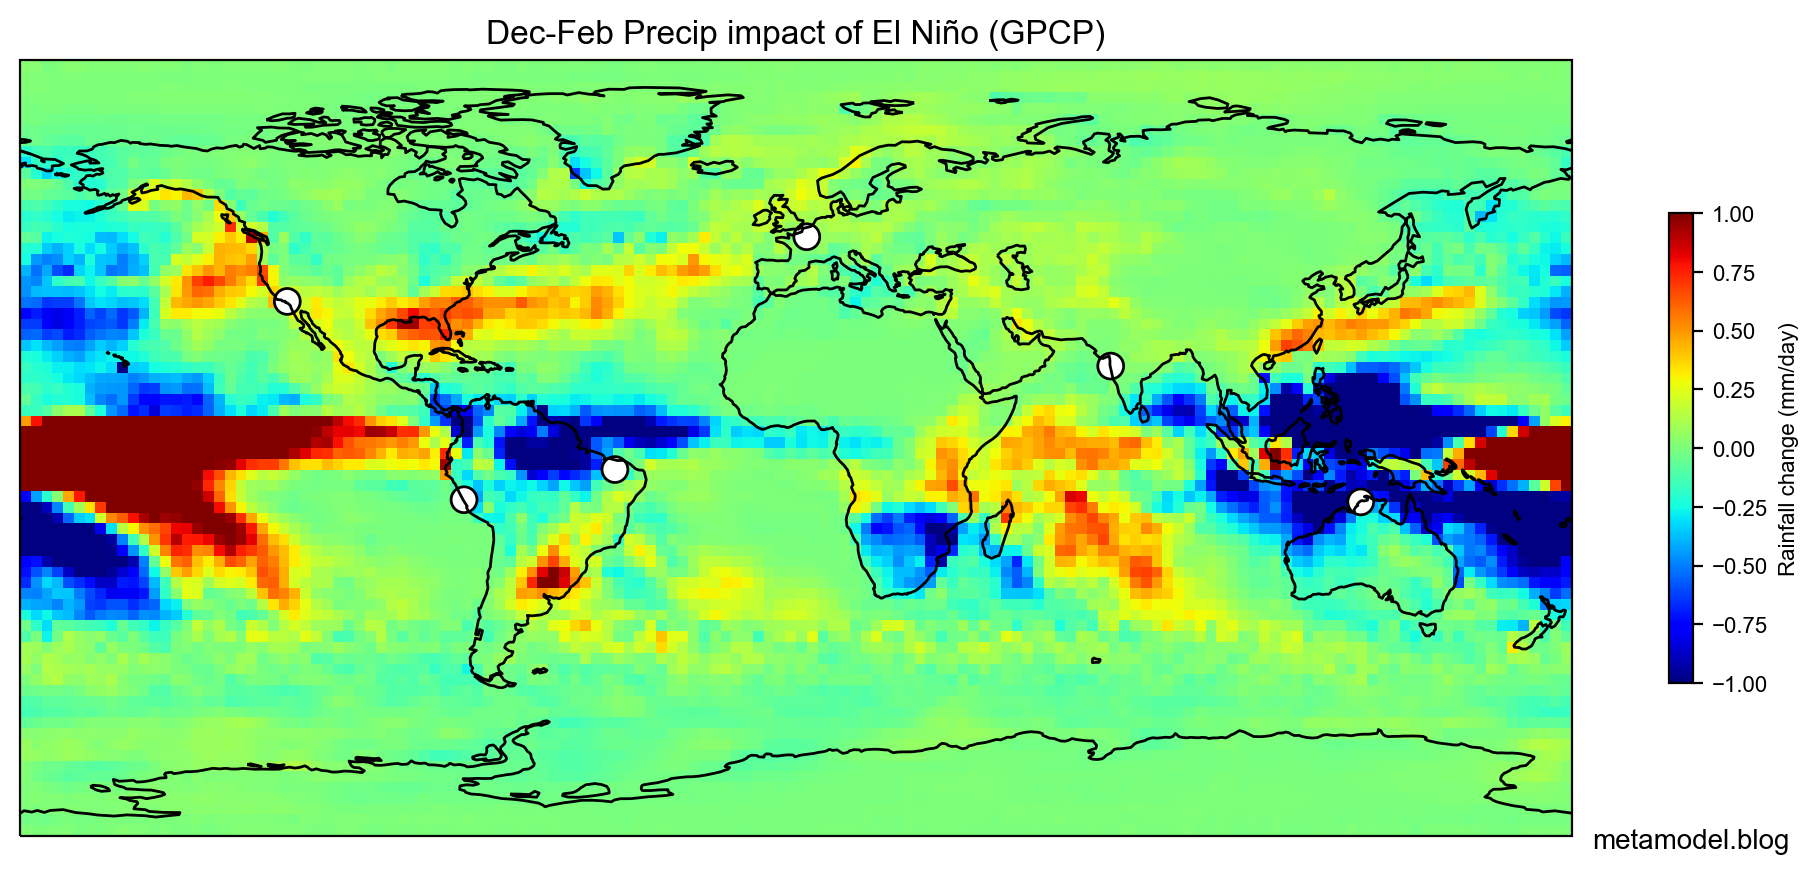
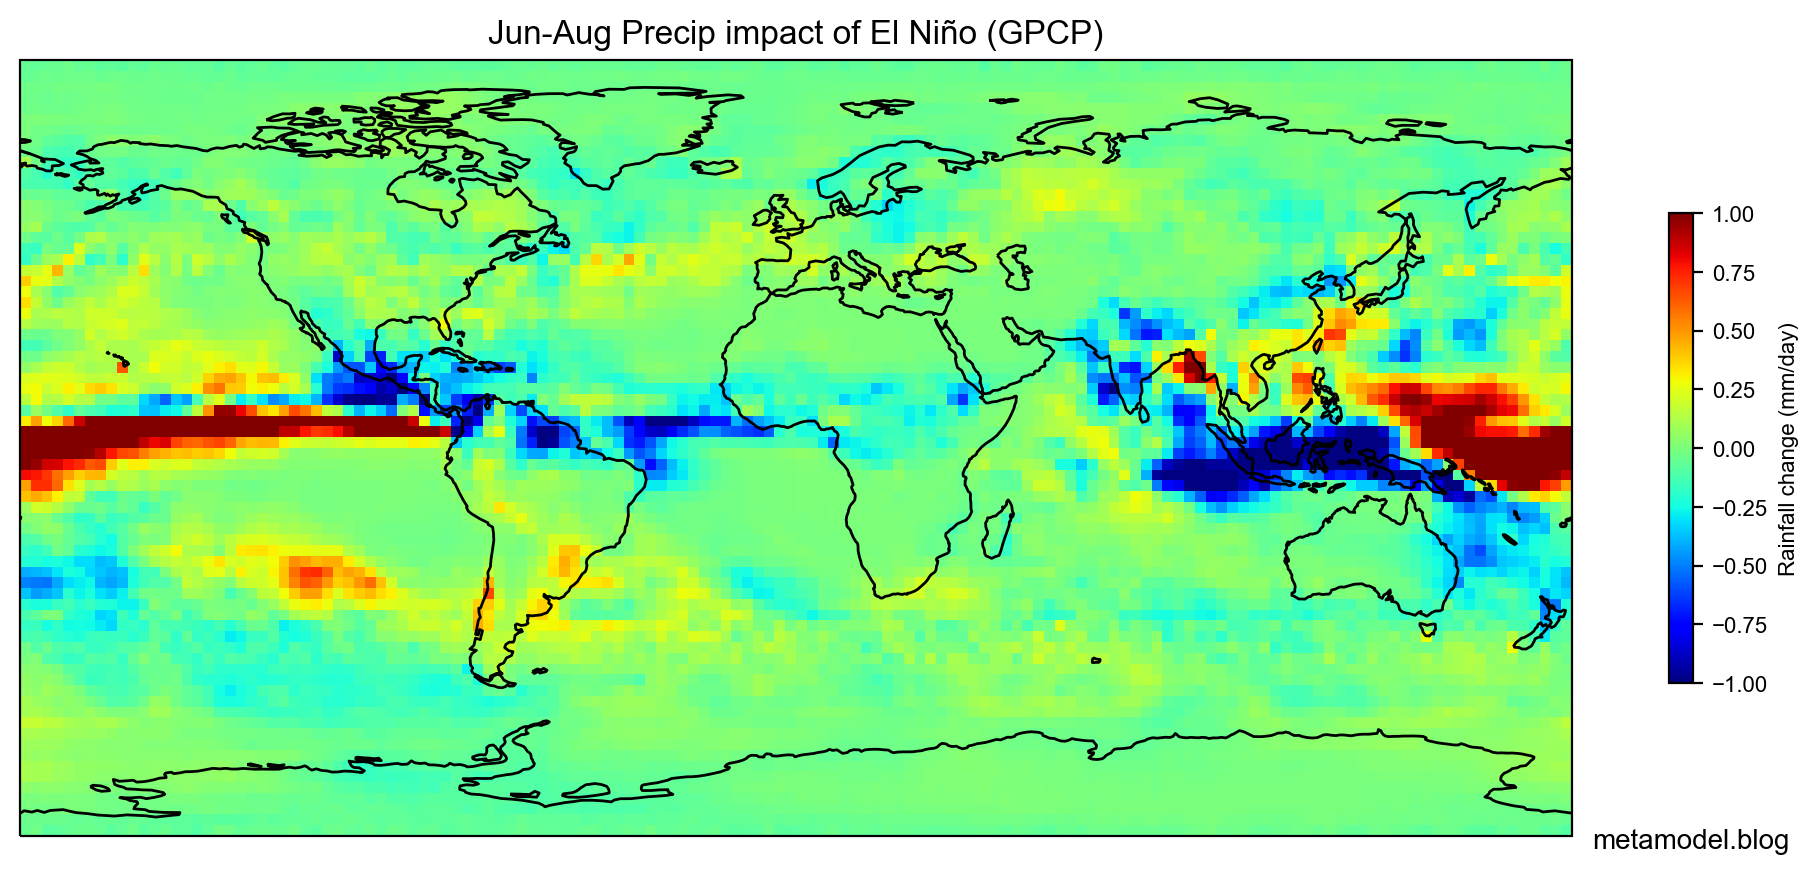
Rainfall (GPCP dataset)