
Can we predict global warming using only statistics?
R. Saravanan
P#4 • ePUB • PDF • 14 min • comments
If you want to make a prediction, you better make sure that you’re either in sample, or that you know the differential equation. 1
In discussions of global warming, you sometimes hear arguments that you can’t trust the complex climate models, that we should rely solely on data to predict the future, and that we should observationally constrain model predictions. This leads us to ask: Can we predict global warming using only statistics? We also ask a related question: Can we identify the causes of global warming using pure statistics?
Let us start by defining temperature as that which is measured by a thermometer, and global warming as a rise in the global average temperature of the order of 2°C over 200 years. It is the typical magnitude of warming that is expected to occur, say, between 1900 to 2100.
Is global warming unprecedented, i.e., has the planet spontaneously warmed in such a manner in the past? Reliable thermometers were only invented about 300 years ago, and accurate global measurements are available only since the late 19th century. So strictly speaking, we only have records for one event of global warming, the current one that is still ongoing. Therefore, the statistical sample count for the global warming events in the available data is a fraction that is less than one! This is true even though we have over a hundred years of temperature measurements. The measured temperature is the sum of the slow global warming event (the signal) superimposed with many fast events, such as El Niño (the noise) (Figure 1). We need multiple independent samples of global warming to separate the signal properties from the noise.
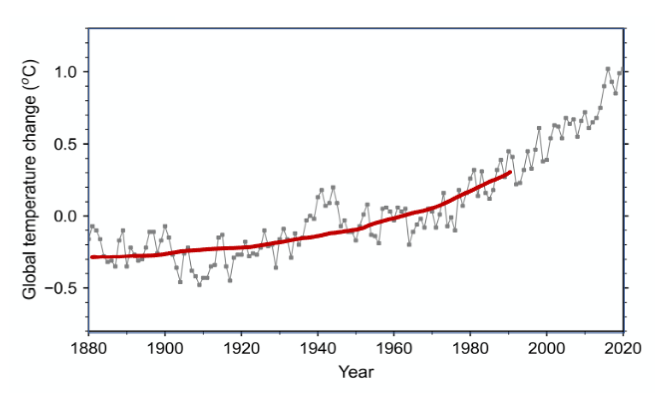 Figure 1 Annual global average surface temperature change with reference to the1951—1980 base period (grey line with boxes). Thick red line shows the monotonic global warming signal. [NASA GISTEMP v4 dataset]
What if we relax the definition of temperature to allow inferred measurements of temperature? For example, pollen, sediments, ice cores etc. serve as proxy records of indirect information about local temperatures. We then need to use several different models, involving assumptions about isotope fractionation, rainfall patterns, etc., to infer temperatures from these proxies. At this point, we would no longer be analyzing pure data, but model-filtered data.2 This means that we have to take into account model-related errors into the data analysis.
Analyses of proxy records over the past several thousand years show that the current global warming event is unprecedented compared to climate variations during that period.3 If we look further back in time, many millions of years, there were larger warming (and cooling) events, but they occurred over many millennia, not a few centuries (as far as we can tell using imperfect data). So the rapid 2°C warming over 2 centuries remains unprecedented in pace, if not in amplitude.
Once we conclude that the current global warming is occurring in an unprecedented manner, we can no longer rely solely on data to predict its future time evolution. Trying to predict global warming using a purely statistical model is like trying to predict the very first observed El Niño event using a statistical model. Simple linear extrapolation of the observed warming in the tropical Pacific associated with El Niño would have missed the quasi-cyclical aspect of the phenomenon. Now that we have data from many El Niño events, we can build skillful statistical models for El Niño prediction that account for the quasi-cyclical aspect.
Over any short enough recent period, say a couple of decades, we can approximate global warming as a linear trend. Extrapolating that linear trend for a couple of more decades may not be a bad approximation. But beyond that, will the trend stay linear? Or will it start to bend upwards parabolically (or amplify exponentially) at some future time? Or will it start to slow down like the square-root function or flatten like a sinusoid curve? (Figure 2) Data alone cannot tell us how the ongoing global warming event will evolve because we have no examples of past global warming events to fit our statistical models.
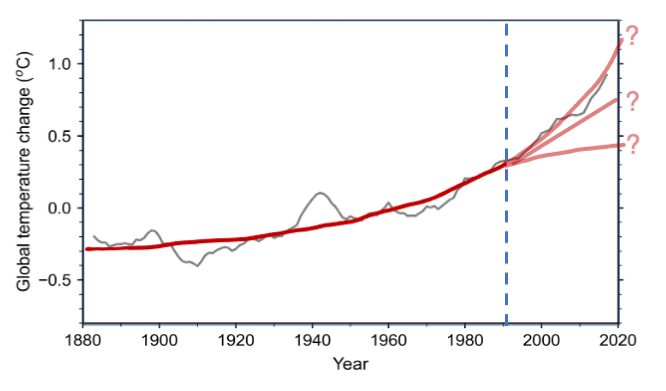 Figure 2 Seven-year moving average of the annual global average surface temperature change in Figure 1 (grey line). Thick red line shows a schematic of three alternative predictions of global warming after 1990. Without precedents, statistics cannot choose between the divergent predictions
Science-based models should be able to predict an unprecedented nonlinear event, but these models suffer from many imperfections. The coarse spatial grid of a global climate model cannot capture important fine-scale processes like clouds. Therefore, approximate formulas called parameterizations are used to represent clouds. Other processes, including the carbon cycle, are also represented using approximate formulas that are calibrated using data. The uncertainties associated with these approximations result in a considerable spread in the predictions of science-based models. The spread turned out to be particularly large in the latest generation of science-based climate models, known as CMIP6.4
Frustration with the growing complexity of global climate models and the uncertainties in their parameterizations can motivate scientists to look for alternatives — perhaps there is a statistical approach that relies on pure data to analyze and predict global warming, uncontaminated by imperfect models. One can learn a lot from statistical analysis of data. But when it comes to actual prediction of global warming, the grass may not really be greener on the statistical side.
To highlight some important issues in applying statistics to global warming, we consider two recent studies that resort to statistical approaches, but in rather different ways. One is the comprehensive IPCC AR6 report5 that applies statistical “observational constraints” to model predictions. The other is a more narrow study, a recent paper by Koutsoyiannis and co-authors (K22) that uses a purely statistical approach to address the causality of climate change.6
A common refrain of those favoring statistical approaches is to let “the geophysical records speak for themselves” (a direct quote from the K22 paper). Like a chatty old person at a party, data can speak and tell you many stories, but they may not be interesting to you. You may want to know how fast the current centennial scale warming will progress, but data may tell you instead about past warming that occurred at a more “glacial” multi-millennial timescale. Often, these data stories need interpretation and translation. You need scientific context to interpret stories about correlations. You need models to translate stories about pollen into statements about temperature.
Adjusting model predictions using data
First, we consider the IPCC assessments. Previously, the IPCC relied solely on science-based global climate models for predicting global average temperature. But for the most recent IPCC assessment (AR6), some of the newer models were predicting much more warming than the previous generation of models, which was at variance with new observational constraints. To deal with this, the IPCC has introduced a complicated hybrid approach that includes statistically constrained “emulator” models.
The emulators are highly simplified climate models with adjustable coefficients. The coefficients in the emulator equations are “calibrated” using results from complex science-based global climate models. For example, if the global models were simulating too much warming during the observed period, the emulators would also do that. But we can adjust some coefficients in the emulators to constrain the rate of simulated warming. The adjusted emulators can then be used to extrapolate into the future. (Ideally, the global models should be adjusted at the process level to improve their simulated warming.7 Presumably the IPCC resorted to a short-cut because adjusting the innards of global climate models is much harder than adjusting the globally averaged parameters of emulators.)
Are these emulators superior to the global climate models? Yes, and no. Yes, because they provide an ad hoc fix for the immediate problem of some models predicting too much warming. No, because they are still calibrated using the global models. The observational constraints cannot fix all the deficiencies inherited by the emulators from the global models. Also, the emulators predict just the globally averaged temperature. Only comprehensive global models can provide the regional detail needed for risk assessment. (The IPCC introduces the notion of a global warming level (GWL) to combine predictions from emulators with global climate models, but the GWL approach does not provide the temporal information needed for risk assessment.8)
Can’t we directly calibrate the emulator using data, thus avoiding the reliance on global climate models? No, because global warming is an ongoing, unprecedented event. The emulator can emulate the known past but not the unknown future of this event. For a given emission scenario, whether the warming trend of the recent decades will continue as a linear trend, or accelerate/decelerate nonlinearly at some future time (Figure 2), will be determined by the behavior of global models used to train the emulator.9 Even using statistics to constrain long-term equilibrium properties like climate sensitivity cannot fully determine the short-term evolution of global warming. To have more trust in the nonlinear aspects of the emulators, we need to improve the parameterizations in global climate models. However, just making the parameterizations more complex may not reduce the uncertainties, as the recent increase in the spread of model predictions indicates.
Determining the causes of global warming using just statistics
The K22 paper aims to let the data speak for itself by using pure statistics to study global warming. The paper analyzes two different types of precedented events, ice age cycles and year-to-year climate variability. Correlations between temperature and carbon dioxide are computed to determine which is leading which.
For the ice core data, K22 finds that temperature leads carbon dioxide during the multi-millennial ice age cycles. For the year-to-year variability, they also find that temperature leads carbon dioxide. The paper then claims that this result “contradicts common opinion” because the correlations seem to imply that the observed warming is driving the observed increase in carbon dioxide. But this is a misinterpretation arising from the conflation of processes occurring at different timescales. Both correlations identified in the paper are well-known relationships at their respective timescales, and are not inconsistent with the notion that carbon dioxide leads temperature on centennial timescales. (The year-to-year correlations between temperature and carbon dioxide have been discussed in many earlier studies.10)
With no scientific context, it is easy to misinterpret statistical correlations because:
-
Correlation does not imply causation: If correlation analysis reveals that changes in variable A lead changes in variable B, it does not mean A causes B. There could be a third variable C that is controlling both. For the ice core correlations analyzed by K22, the third variable is the Earth’s orbital perturbations that affect the amount of sunlight received.11 Warming at the end of an ice age releases stored carbon dioxide into the atmosphere. For the interannual correlations analyzed by K22, the third variable is likely the El Niño index, which affects both temperature and carbon dioxide.
-
Correlation between variables depends on timescales: The climate system has different processes, with different causal mechanisms and different lead-lag relationships between temperature and carbon dioxide, that co-exist and operate at different time scales. This includes ice age cycles, the seasonal cycle, and the year-to-year El Niño variations, and global warming. To the extent data of multiple realizations of a process are available, statistics can capture the lead-lag relationships of a specific process associated with a particular timescale. We have such data for the ice ages, the seasons, and El Niño events, but not for the rapid global warming that is happening now.
-
A trend is correlated with every other trend: You can correlate an increase in global temperatures with the increase in the stock market index or just about any other quantity that has increased over the last century. Monotonic trends are a nuisance in correlation analysis and are usually subtracted out before computing correlations. Therefore, we cannot infer anything causal about the current global warming event from a purely statistical analysis of trends in recent data.
Only by introducing a comprehensive scientific framework can we extract useful information from observed correlations and trends. A partial scientific framework can still lead to misinterpretation of results from data analysis if important processes are neglected.
Conclusions
We cannot predict or explain an unprecedented nonlinear phenomenon using statistics alone.12 A comprehensive science-based model can predict an unprecedented event because it solves the differential equations governing the phenomenon. But how much we should trust that prediction depends upon how accurately all the relevant equations are known. Statistical analysis can help improve the equations in the science-based models, and constrain some of their properties, but it cannot replace them for predicting the temporal and spatial detail of future global warming.
Winston Churchill said that “democracy is the worst form of government except all those other forms that have been tried”. We could say the same of complex global climate models — they are imperfect but alternatives such as purely statistical models or highly simplified models are even less scientifically defensible for predicting climate. And we need models to plan for the future.
Note:
Some outside mainstream climate science would argue that the current global warming is not unprecedented and that warming events of similar pace and amplitude have occurred naturally before. Multiple lines of evidence do not support this argument,3 but we can consider the hypothetical scenario where global warming has precedents in the data record. In that case, some of the statistical limitations described in this article would no longer apply. However, there is no escaping the need for models.
As noted before, pure data cannot be used to determine whether global warming has precedents, since we do not have global temperature measurements prior to the 19th century. We have to use models to calibrate proxies for temperature in making any such determination. Even if we identify enough past global warming events to provide a sizeable statistical sample, we would need to have accurate temperature data with at least decadal time resolution to train a statistical prediction model. If we manage to do that, we would still require good science-based global climate models to add the necessary spatial detail to any statistical prediction of global average temperature.
-
Attributed MIT Oceanographer Carl Wunsch. See Tweet by Cristi Priostosescu ↩︎
-
Global climate science, uncertainty and politics: Data‐laden models, model‐filtered data (Science as Culture) ↩︎
-
The finding that the current global warming is unprecedented in the paleoclimatic record has attracted its share of controversy and has been discussed at great length elsewhere, including in this report by the US National Academies. We don’t intend to re-litigate that finding here, especially as we now have more data to support it. As a hypothetical case, we do discuss the alternative scenario of global warming having precedents at the end of this article. ↩︎
-
Sensitive but unclassified: Part II (RealClimate.org) ↩︎
-
IPCC AR6 WG1 report, Chapter 4: Future global climate: scenario-based projections and near-term information ↩︎
-
Revisiting causality using stochastics: 2. Applications (Proceedings of the Royal Society A) ↩︎
-
How to judge a model beauty contest? (This blog) ↩︎
-
Use of ‘too hot’ climate models exaggerates impacts of global warming (Science.org) ↩︎
-
This argument also has implications for the use of Machine Learning (ML) for prediction. It is easy to justify using pure ML models for weather prediction, where there is a lot of short-term verification data. It would be hard to justify using pure ML for climate prediction with limited long-term data. We can think of emulation as a form of ML using models. An emulator can be fast, but it will inherit all the structural problems of the models it emulates. It would be better instead to use statistics (or ML) to improve components of a science-based model, such as a cloud parameterization, because more data samples may be available for the phenomenon of interest. ↩︎
-
Variations in atmospheric CO2 growth rates coupled with tropical temperature (PNAS.org) ↩︎
-
Since the sun plays an important role in driving ice age temperature cycles and the seasonal cycle, it is natural to wonder if it could be driving global warming as well. Interestingly, we have a sizeable sample in the observational record of the 11-year sunspot cycle which is associated with slight variations in the amount of sunlight reaching the Earth. However, there is no strong 11-year cycle in global temperatures (Figure 1), which means that those 11-year sunlight variations are too weak in amplitude to affect global temperatures. Could there be a longer-term increasing trend in the amount of sunlight reaching the Earth that explains global warming? Satellite measurements do not show such a trend, and even if there were, a long-term trend would not be very amenable to a purely statistical analysis. ↩︎
-
Predicting the Unprecedented: The Philosophy of Weather and Climate Modeling (Seminar at U. of Maryland) ↩︎