
Who's afraid of the Big Bad El Niño?
R. Saravanan
P#10 • ePUB • PDF • 17 min • comments
WMO’s afraid of the Big Bad El Niño.
The World Meteorological Organization (WMO) says there’s now a 66% chance that we will breach the 1.5°C global warming threshold between now and 2027, as reported in a recent BBC article.1 This increased probability is being blamed on the heat expected from an imminent El Niño. While noting any such breach will be temporary, the article goes on to say that “breaking the limit even for just one year is a worrying sign that warming is accelerating and not slowing down.” A spate of media reports now predicts that the impending Big Bad El Niño will push global warming into “uncharted territory”.2
El Niño, a phenomenon first observed centuries ago by Peruvian fishermen, refers to a sporadic warming of the tropical Pacific Ocean that occurs every 3-7 years.3 These waters, usually cold and teeming with nutrients, would warm considerably, decimating fish populations. The phenomenon typically occurred around December or January, hence its name, El Niño—Spanish for “the boy child”, a reference to Christ.
El Niño’s impact, propagated by atmospheric waves known as teleconnections, extends to regions far removed from the tropical Pacific.4 For instance, it intensifies winter rainfall in California while potentially inducing drought in Australia. Recent warming in the Pacific Ocean has prompted the US weather agency to declare an official El Niño event for 2023.5 When the tropical Pacific warms, it invariably raises the global-average temperature, because the Pacific covers such a large fraction of the globe. This basic arithmetic relationship has fueled a flurry of articles linking El Niño with global warming, prompting questions like:6
- Is the coming 2023 El Niño going to accelerate global warming?
- Will El Niño trigger severe heatwaves in Europe or the U.S.?
- Can El Niño fueled global warming push climate over a tipping point?
The short answer to these questions is a no, because El Niño is a quasi-cyclical natural phenomenon whose physical cause and spatial impacts are distinctly different from human-induced global warming. Why then does the media overtly or subtly suggest otherwise? Because they are conflating the symptom with the disease. A viral sinus infection and a bacterial lung infection and can both raise body temperature to fever levels, but they affect the body differently. Similarly, El Niño and global warming have different spatial patterns of impacts, even as they share the symptom of rising global-average temperature.
We should be afraid of El Niño—where it’s both big and bad. We fear the big bad wolf, but we are not afraid of a small bad chihuahua—and we all love big friendly dogs. El Niño is all the above. Whether you should be afraid of El Niño depends upon where you live, the time of year, and what climate variable you are interested in. For spring rainfall in Northeast Brazil, El Niño is a big bad wolf but for summer temperature in Texas, it’s more of a chihuahua. In some places, El Niño can be a friendly dog, countering global warming by cooling summer temperatures or reducing hurricane activity.7 (You can check if El Niño is going to be a wolf or a chihuahua in your town using two interactive plots in this article: Figure 3 and Figure 7.)
Global warming is an urgent problem that we are dealing with through mitigation and adaptation. We have sort of adapted to El Niño, because it is a natural phenomenon. Will the coming El Niño take us into uncharted territory? To answer that, we have to explore the charts we’ve got. We start in Global-average Land, undoubtedly the best charted and most popular climate destination. Then we travel to less-explored Local-average Lands and end by explaining how El Niño is counterintuitive in many ways.
When preparing this article, despite a ton of published material on El Niño over several decades, finding graphics that directly compared El Niño and global warming in a relevant way wasn’t easy. So, I wrote code to generate all the figures in this article (except for the schematic). The code is available as a Python notebook on Google Colaboratory.8 A better set of clickable plots of El Niño impacts for is available on a separate web page.9
Simple narratives in Global-average Land
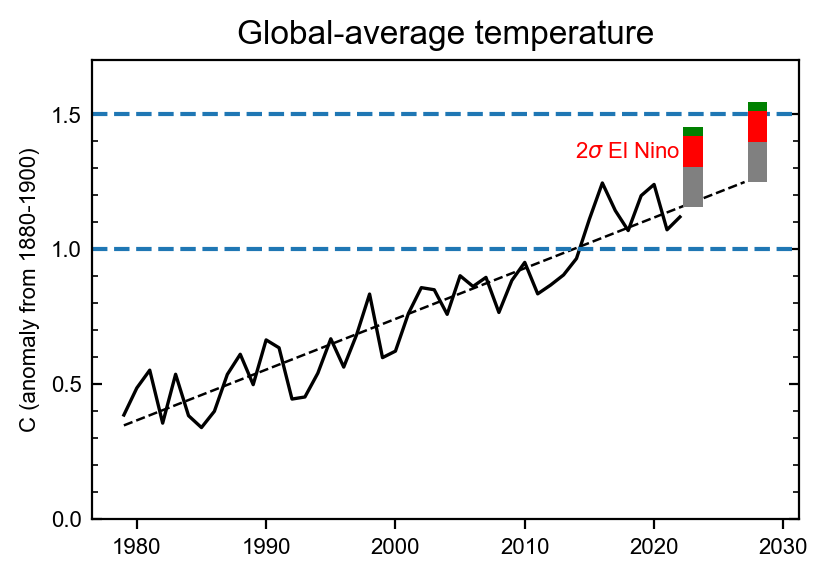 Figure 1 Global-average temperature during 1979-2022 from the NASA GISTEMP4 dataset. The dashed line shows the linear trend. For 2023 and 2028, the red bar estimates the impact of a strong (2σ) El Niño event on the global average, derived through linear regression. The grey bar represents an estimate of measurement error, because GISTEMP estimates could be approximately 0.15°C lower than some other estimates. The green bar represents an estimate of the warming effect of Hunga Tonga eruption (0.035°C).10
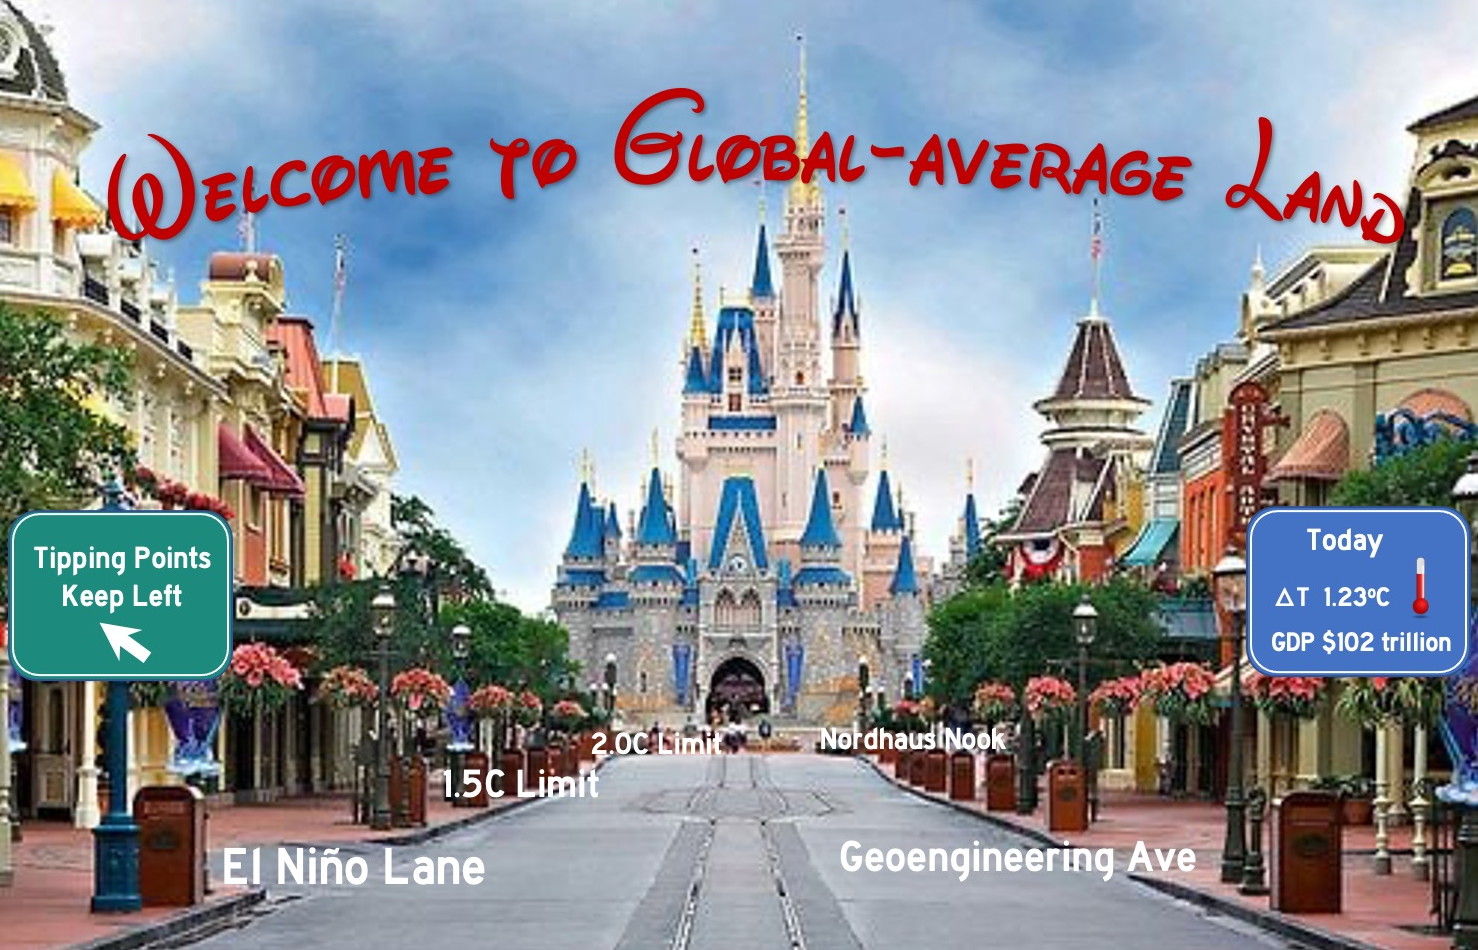
Global-average temperature has become the totemic11 metric of global warming.12 The complex phenomenon of long-term regional warming driven by carbon emissions is often simplified to narratives focused on global-average temperature. This simplification unfolds in global-average land, where discussions about warming thresholds, tipping points, and geoengineering frequently take place. In this simplified world, El Niño is no different from short-term global warming. That explains why media coverage fixates on how the 2023 El Niño might raise global-average temperatures, breaching the 1.5°C threshold (Figure 1).
However, global-average land is like Disney’s Magic Kingdom—a refuge from the complexity of reality where many scientists, economists, reporters and policymakers like to hang out.13 Real people, though, live in cities, counties, and countries, where it matters how hot (or cool) it’s going to be locally, not in some abstract global-average.14 Important details of climate change, such as regional warming and drying patterns, are absent in global-average land. The globe is not heating uniformly; it’s warming faster near the poles but slower in the tropics (Figure 2). In fact, some parts of the ocean have been getting slightly cooler over the past 40 years!
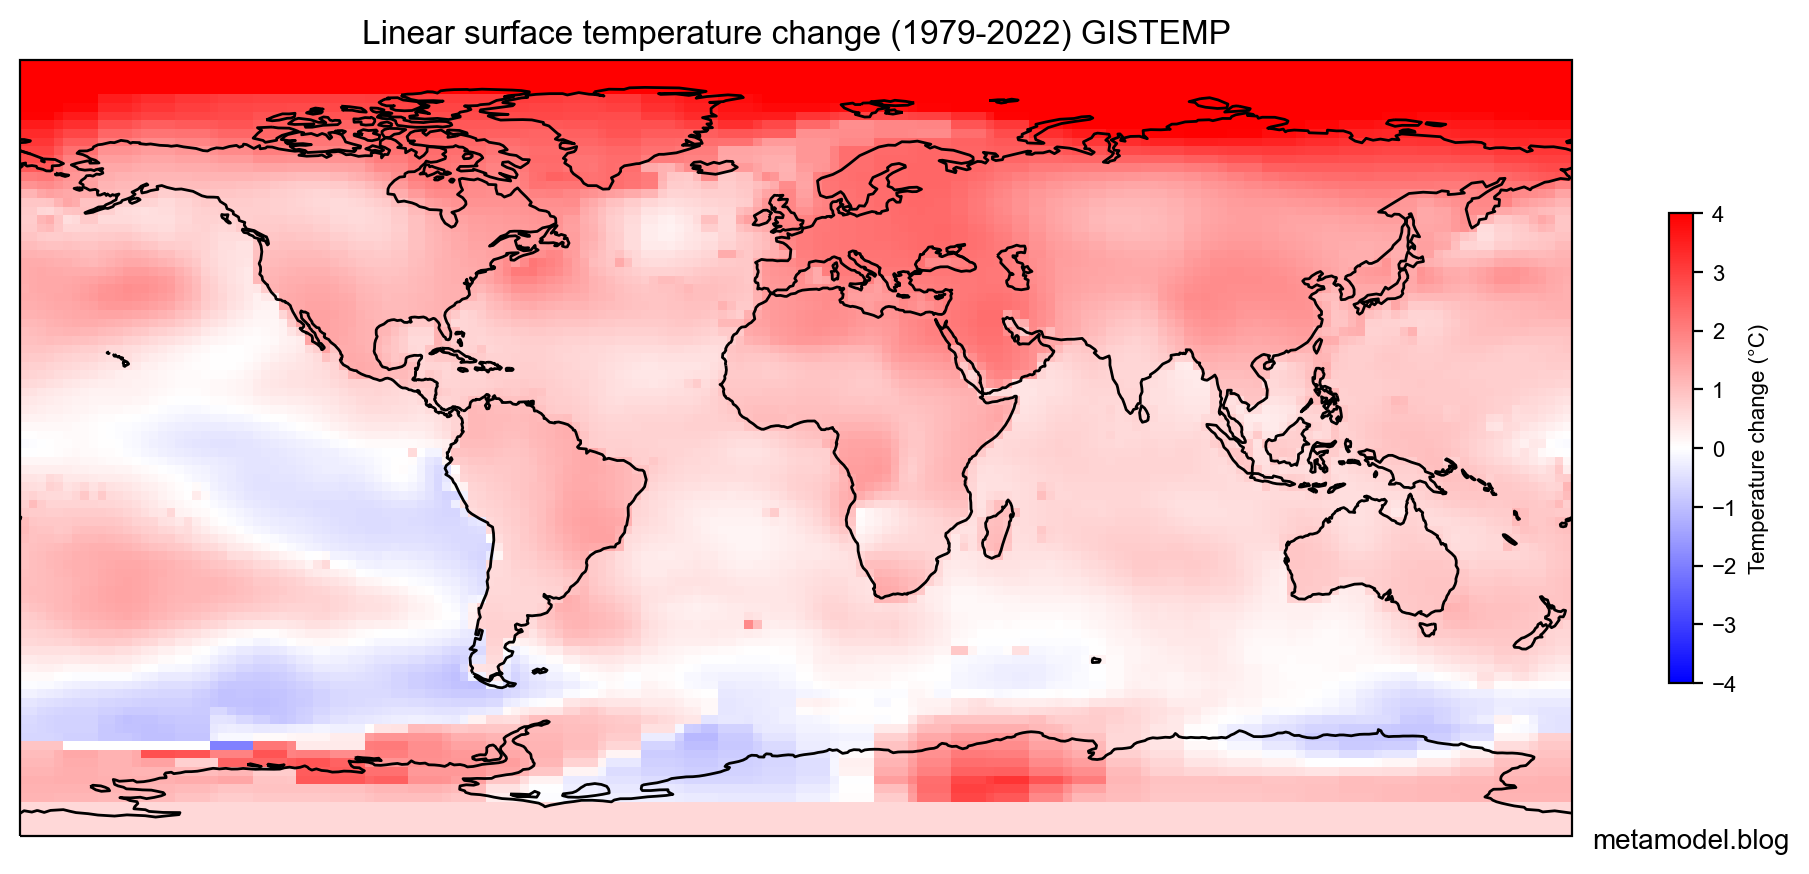
Figure 2 Linear change in surface temperature between 1979-2022. NASA GISTEMP4 data
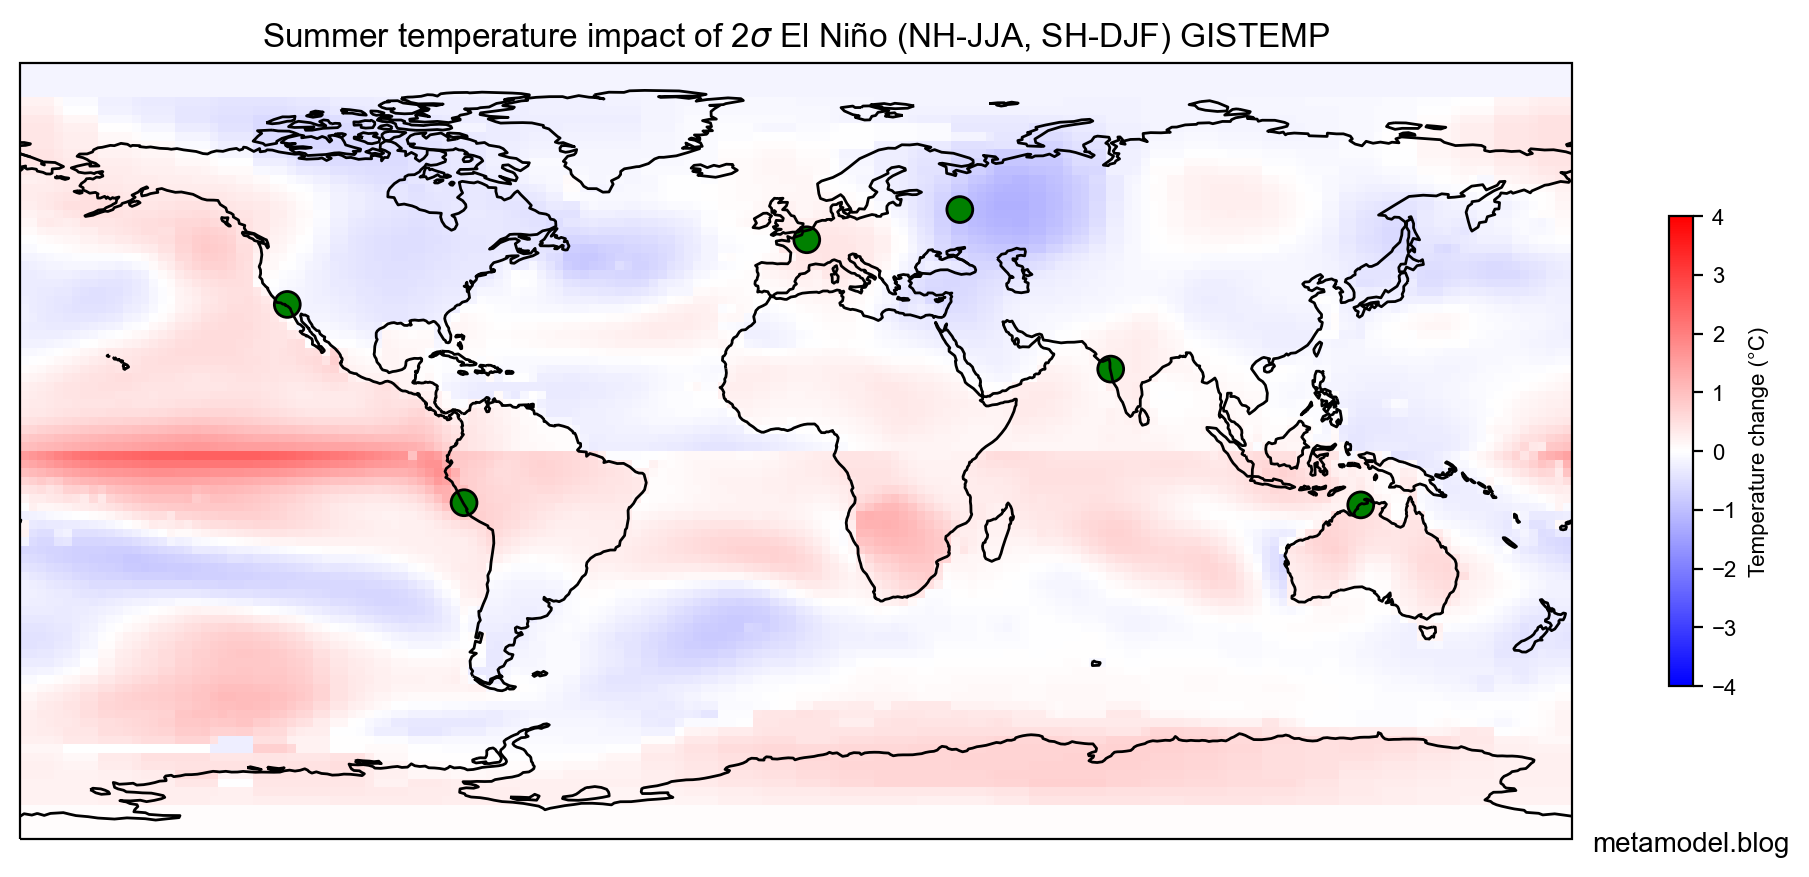
Figure 3 Regression of seasonal surface temperature against the NINO3.4 El Niño index (multiplied by 2 to capture the impact of a strong El Niño). Summer regression is presented for each hemisphere: Jun-Aug for northern and Dec-Feb for southern. Green circles denote time series locations for Figure 5. Note that the regression map isn’t masked for lack of statistical significance in order to the highlight the estimated impact of El Niño. The actual impact may be weaker than what is shown. Also, even statistically significant correlations may not be practically relevant if they are low. [NOTE: This figure is interactive. Click anywhere on the globe to compare the local time series of seasonal temperature to the global warming trend and the regressed signal of 2σ El Niño to visually assess the statistical and practical significance. Alternatively, enter latitude, longitude values in the box and use button+drop-down to generate overlay/inline plot. Click on any blank area of plot to make it go away.]
The much-discussed 1.5°C warming threshold is also a concept that belongs to global-average land. This threshold was originally proposed to deal with a more gradual but inexorable aspect of climate change—sea level rise.15 Island nations were afraid that the Paris Agreement’s 2.0°C warming target wasn’t aggressive enough to stop sea-level rise, as sea level would continue to rise even after we stopped all emissions.16 So they pushed for the tougher 1.5°C warming target. The talk of a planetary boundary or climate tipping point at 1.5°C warming came later—what was just a convenient round number target to start with became a physical threshold that should not be crossed.17
Different ways of measuring surface temperature give different values for current global warming, sometimes as much as 0.1-0.2°C different. We don’t have good temperature data from before the industrial age, so we can’t say precisely how much warmer it is now.18 So, even if there were a physical threshold that should not be crossed, we couldn’t tell if it’s at 1.4, 1.5, 1.6°C. WMO’s recent projection of a 66% probability of El Niño pushing beyond use over the 1.5°C threshold would be quite different if we used a different temperature dataset (Figure 1).
Instead of worrying about poorly defined global tipping points or fuzzy thresholds,19 we should be focused on the nonlinearity of local damage functions, or how impacts of climate change accelerate as local temperatures increase. Going from 1.5 to 1.7°C will typically cause more than twice as much harm as going from 1.5 to 1.6°C, because we are adapted to our current climate. Every tenth of a degree hurts, but the later tenths hurt even more!
Getting back to El Niño: Talking about how it raises the global-average temperature misses the point that El Niño affects different regions in different ways. We look at how summer temperatures change with El Niño in both hemispheres, to understand how it may affect heatwaves (Figure 3). We see that the pattern of El Niño’s impact differs greatly from that of long-term warming—it exhibits less spatial consistency, reveals extensive cooling areas, and is strongest in the tropics. Its influence spreads from the tropical Pacific through waves that can alternately warm and cool as they propagate. Global warming is more of a local thermodynamic effect that warms almost everywhere.
In practical terms, if you live in the southern US and hear a forecast that global-average temperature will rise by 0.1°C due to El Niño, should you brace yourself for more heatwaves? Not really. El Niño typically slightly cools the southern US during summer. While some places will indeed experience hotter summers (and more heatwaves) due to El Niño, many places won’t experience any notable warming attributable to El Niño. That’s different from global warming, which makes summer heatwaves worse across North America and Europe. That said, El Niño does ramp up heatwaves in some tropical areas and a few spots in the southern hemisphere, such as southern Africa and eastern Australia.
Charting signal vs. noise in Local-average Lands
Often, El Niño discussions centering on its spatial pattern default to schematic maps (Figure 4). These maps tell us the sign of the seasonal impacts, but not the relative strengths of those impacts compared to natural variability or global warming. The maps don’t tell us if it is a 5% effect or a 50% effect, for example.
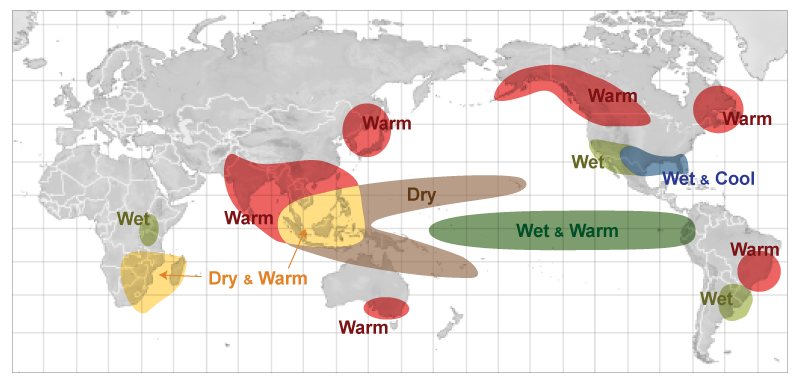 Figure 4 How El Niño affects weather during December to February. [Image from weather.gov]
We need more than schematic maps to understand how global warming affects different geographical regions, and how that differs from El Niño. We need to look at how local temperature changes over time (Figure 5). The global warming signal dominates the global-average time series, but it is less conspicuous at regional scales. Natural fluctuations in year-to-year local temperature play a bigger role regionally. We can also see how the tropics warm more slowly, and the polar regions warm much faster.
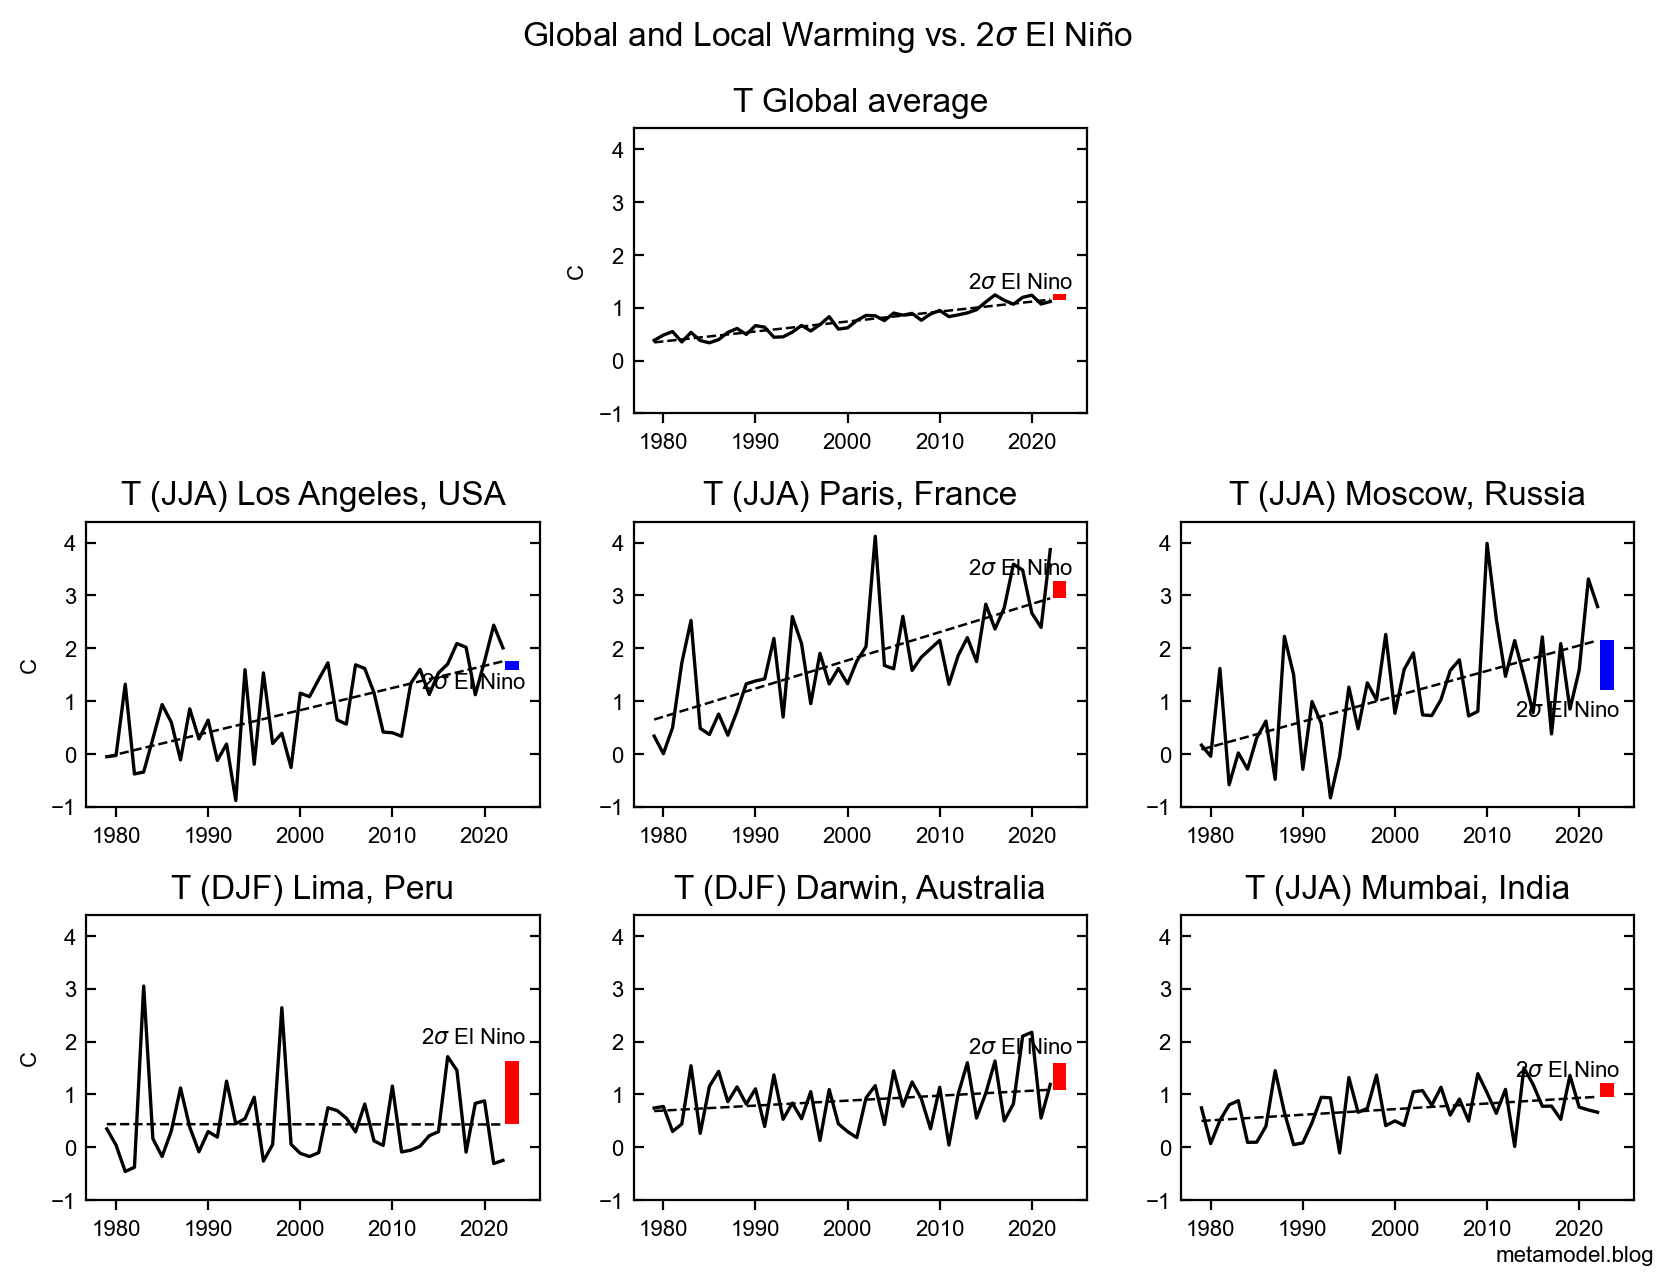 Figure 5 The top panel reproduces the global-average temperature time series shown in Figure 1, but with a larger range for the Y-axis. Lower panels show local temperature changes during summer at locations marked by green circles in Figure 3. The dashed line displays the fitted linear trend. The red/blue bars denote the warming/cooling impact of a strong (2σ) El Niño, as estimated by linear regression. [Click on Figure 3 to make your own plot for your favorite location.]
El Niño is considered the 800-pound gorilla of seasonal prediction,20 but even a strong (2σ) event does not always stand out against the backdrop of natural variability and global warming. The impact of a strong El Niño on summer temperatures is significant in some tropical regions, but usually quite mild outside the tropics (see also Figure 3). In Lima, for instance, heatwaves would not be attributable to global warming, as there is no discernible long-term temperature trend. However, they can be attributed to El Niño. On the other hand, in Los Angeles, it’s the other way around: there’s long-term local warming, but El Niño has only a weak cooling effect during summer.
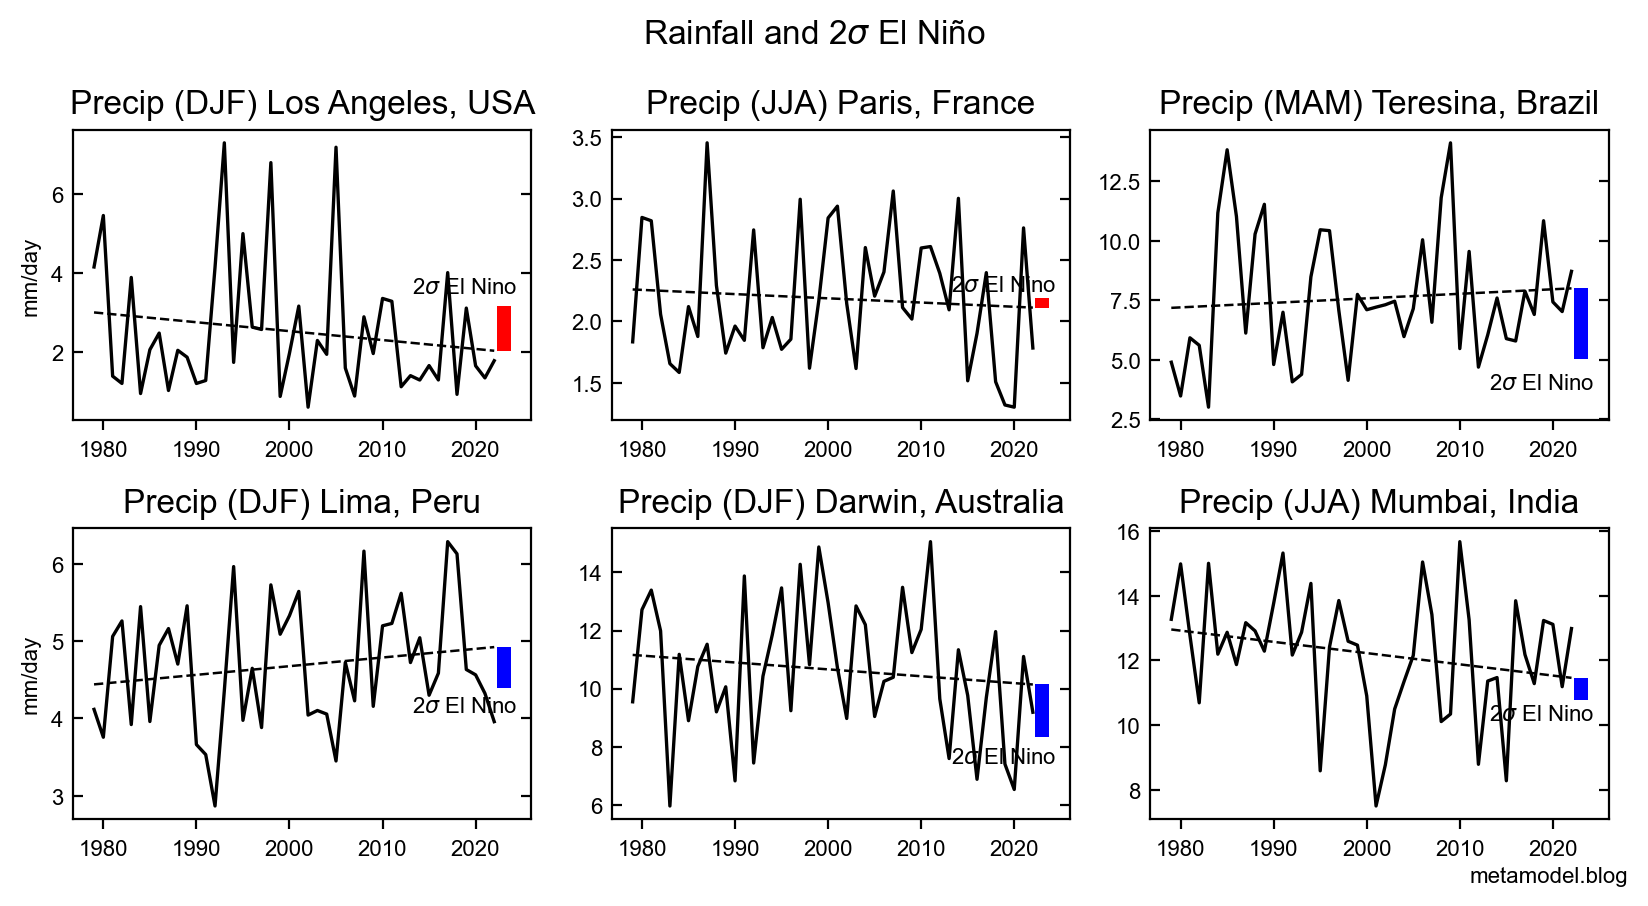 Figure 6 Local seasonal rainfall between 1979 and 2022 in selected cities marked as white circles in Figure 7. Dashed line represents the fitted linear trend. Red/blue bars show the moistening/drying impact of a strong (2σ) El Niño, as estimated by linear regression. Note: The Y-range varies for each location. [Click on Figure 7 to make your own plot for your favorite location.]
Besides temperature, El Niño influences rainfall patterns around the globe (Figure 6). However, rainfall is naturally more variable than temperature. This means the global warming signal is weaker and more regionally disparate. The El Niño influence on rainfall is largely confined to the tropics and the subtropics, but with some exceptions like California and the southern US (Figure 7). When attributing heavy rainfall events to El Niño, we should consider the signal-to-noise ratio rather than relying on schematic diagrams such as Figure 4. Attributing droughts is even tricker, as numerous other factors could also play a role.21
Could a strong El Niño in 2023-24 propel us into “uncharted territory”? In the simple temperature charts common in global-average land (e.g., Figure 1), it certainly seems plausible. But you can draw your own conclusions after considering the other local charts presented in this article (Figures 5 and 6).
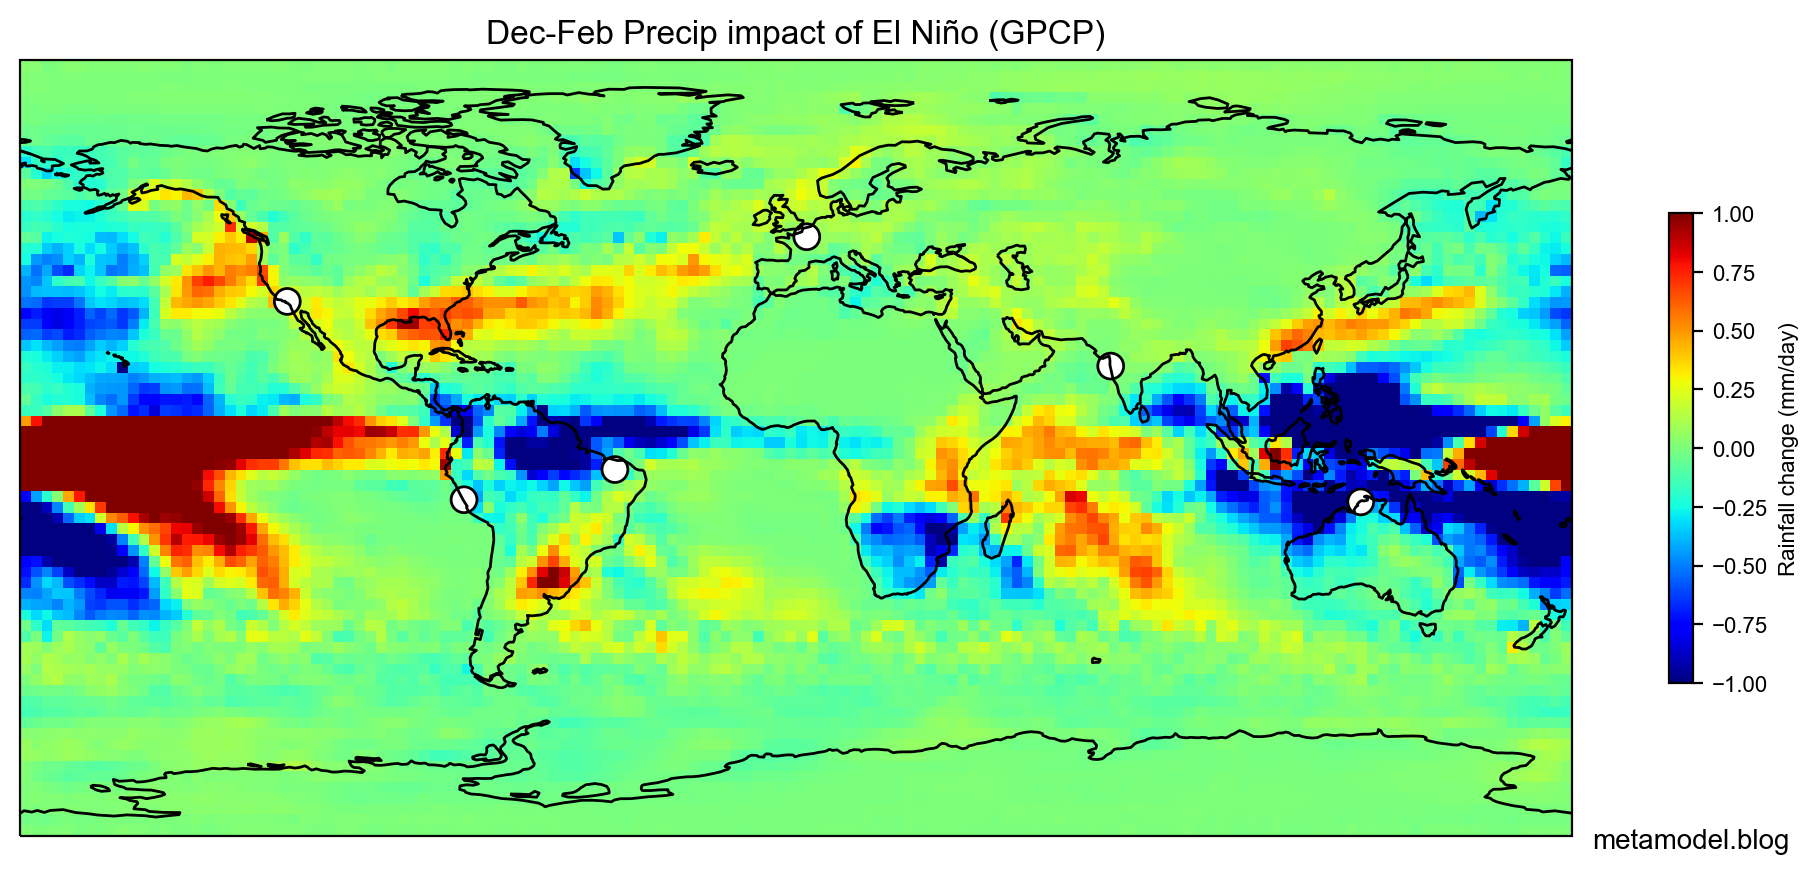
Figure 7 Seasonal rainfall from December to February, regressed against the El Niño index. White circles show time series locations for Figure 6. (The June-August regressions, which are not shown, are weaker. Data sourced from Global Precipitation Climatology Project). [NOTE: This figure is interactive. See Figure 3 caption for details on interactivity.]
Counterintuitivity of El Niño
Focusing solely on global averages can be misleading—it is akin to mistaking the symptom for the disease. Narratives set in global-average land are often compelling because they appear simple. But El Niño is a product of complex interactions between the atmosphere and the ocean that often exhibit counterintuitive behavior.
Will El Niño amplify the impacts of global warming, as one would intuitively expect because it elevates the global-average temperature? That could happen in a few regions, located mostly in the tropics and the subtropics (Figure 3). Elsewhere, El Niño is associated more with cooling than warming, which effectively opposes the effects of enhanced global warming in these regions.
Could El Niño prompt an earlier breach of the 1.5°C threshold? Technically, yes, but practically no! Recall that the original aim of this threshold was to slow the increase in ocean heat content and subsequent sea level rise. Since El Niño is associated with warmer temperatures, one might expect that it will increase the heat stored in the ocean. Indeed, the ocean surface warms during El Niño because cold water stops upwelling to the surface in the eastern tropical Pacific (as the Peruvian fishermen noticed). But the overall heat stored in the whole ocean actually decreases during a typical El Niño event because warmer water loses more heat through evaporation,22 which means that El Niño delays the harm that originally motivated the 1.5°C threshold! It is during La Niña, the opposite phase of El Niña, that the total heat stored in the ocean increases (as it also does in the long-term due to global warming).
Given that the effects of El Niño and La Niña cancel each other in the long-term, it makes little sense to talk about El Niño accelerating or decelerating global warming. However, it is meaningful to wonder whether global warming could amplify El Niño. A simple narrative in global-average land would be that global warming will lead to stronger El Niño episodes, because the ocean is getting warmer. Yet, El Niño is primarily driven by east-west temperature gradients, not absolute temperatures.
The trade winds blow from the cool east to the warm west, pushing the tropical Pacific waters westward and creating the cool upwelling region off Peru’s coast. El Niño temporarily disrupts this process and warms the eastern Pacific. Forecasting the specifics of how these east-west temperature gradients will change in the coming decades turns out to be more challenging than predicting changes in global-average temperature. In fact, climate models have yet to reproduce the cooling trend observed in the eastern tropical Pacific over the last 40 years (Figure 2).23 (Focusing on model simulations of global-average temperature overlooks important details like this.)
Climate models also disagree on how long-term global warming will affect future El Niño events. Some models predict an increase in the amplitude of El Niño over the next few decades, followed by a decrease by the century’s end. Others predict a consistent increase or even decrease in amplitude.24 This uncertainty means that attributing a stronger than usual El Niño to global warming will be much harder than attributing a heatwave to global warming.
El Niño isn’t global warming. We should worry about global warming (in most places), and prepare for El Niño (in fewer places), but we shouldn’t conflate the two. We can’t prevent or mitigate El Niño. Like the warming associated with sunrise or summer, the warming associated with El Niño is completely natural—albeit more unpredictable. What is not natural is the global warming driven by increasing carbon emissions. We can and should take stronger action to mitigate it.
-
Global warming set to break key 1.5C limit for first time (BBC) ↩︎
-
UN warns Earth’s temperature likely to soar to record levels due to global warming and El Niño: ‘Uncharted territory’ (USA Today) ↩︎
-
The Human History of El Niño (NASA.gov) ↩︎
-
What are El Niño and La Niña? (NOAA.gov) ↩︎
-
June 2023 ENSO update: El Niño is here (Climate.gov) ↩︎
-
Rapidly developing El Niño set to boost global warming (Axios); Warning of unprecedented heatwaves as El Niño set to return in 2023 (The Guardian) ↩︎
-
Atlantic hurricane season 2023: El Niño and extreme Atlantic Ocean heat are about to clash (TheConversation.com) ↩︎
-
You can access the Python notebook code in Google Colaboratory. You can make a copy of the code, run it using just your browser and reproduce the entire analysis in less than the time it takes to read this article. The code will automatically download all the data it needs from the web and create the figures. (If you find any bugs, let me know!) ↩︎
-
Better clickable interactive plots of El Niño impacts are available on this web page ↩︎
-
Tonga Eruption May Temporarily Push Earth Closer to 1.5°C of Warming (Eos) ↩︎
-
When something becomes totemic, it gains a status that is out of proportion to its real importance. (Cambridge Dictionary) ↩︎
-
Global warming above 1.5C could trigger ‘multiple’ tipping points (CarbonBrief.org) ↩︎
-
Damage Functions (or Why I am Mad at Climate Economists)](https://lpeproject.org/blog/damage-functions-economics-climate-science/) ↩︎
-
“[Global Mean Temperature] provides little insight on how acute risks likely material to the financial sector (‘material extremes’) will change at a city-scale.” Acute climate risks in the financial system: examining the utility of climate model projections (A. J. Pitman et al., 2022; Environmental Research: Climate) ↩︎
-
Addicted to global mean temperature (Isaac Held’s Blog; gfdl.noaa.gov) ↩︎
-
1.5°C: where the target came from – and why we’re losing sight of its importance (TheConversation.com) ↩︎
-
Why are the (climate) numbers so round? (Metamodel.blog) ↩︎
-
Will global temperatures exceed 1.5C in 2024? (Substack) ↩︎
-
Mechanisms and Impacts of Earth System Tipping Elements (S. Wang et al., 2023; Reviews of Geophysics) ↩︎
-
Slow slosh of warm water across Pacific hints El Niño is brewing (Climate.gov) ↩︎
-
Why El Niño doesn’t mean certain drought (TheConversation.com) ↩︎
-
“While there are distinct regional … changes, many compensate each other, resulting in a weak but robust net global ocean cooling during and after El Niño.” Evolution of Ocean Heat Content Related to ENSO (L. Cheng et al., 2019; Journal of Climate) ↩︎
-
Systematic Climate Model Biases in the Large-Scale Patterns of Recent Sea-Surface Temperature and Sea-Level Pressure Change (R.C.J. Wills et al., 2022; Geophysical Research Letters); How the pattern of trends across the tropical Pacific Ocean is critical for understanding the future climate (Climate.gov) ↩︎
-
The future of the El Niño–Southern Oscillation: using large ensembles to illuminate time-varying responses and inter-model differences (N. Maher et al., 2023; Earth System Dynamics) ↩︎