
Texas Heatwave and Occam's Razor
R. Saravanan
P#11 • ePUB • PDF • 11 min • comments
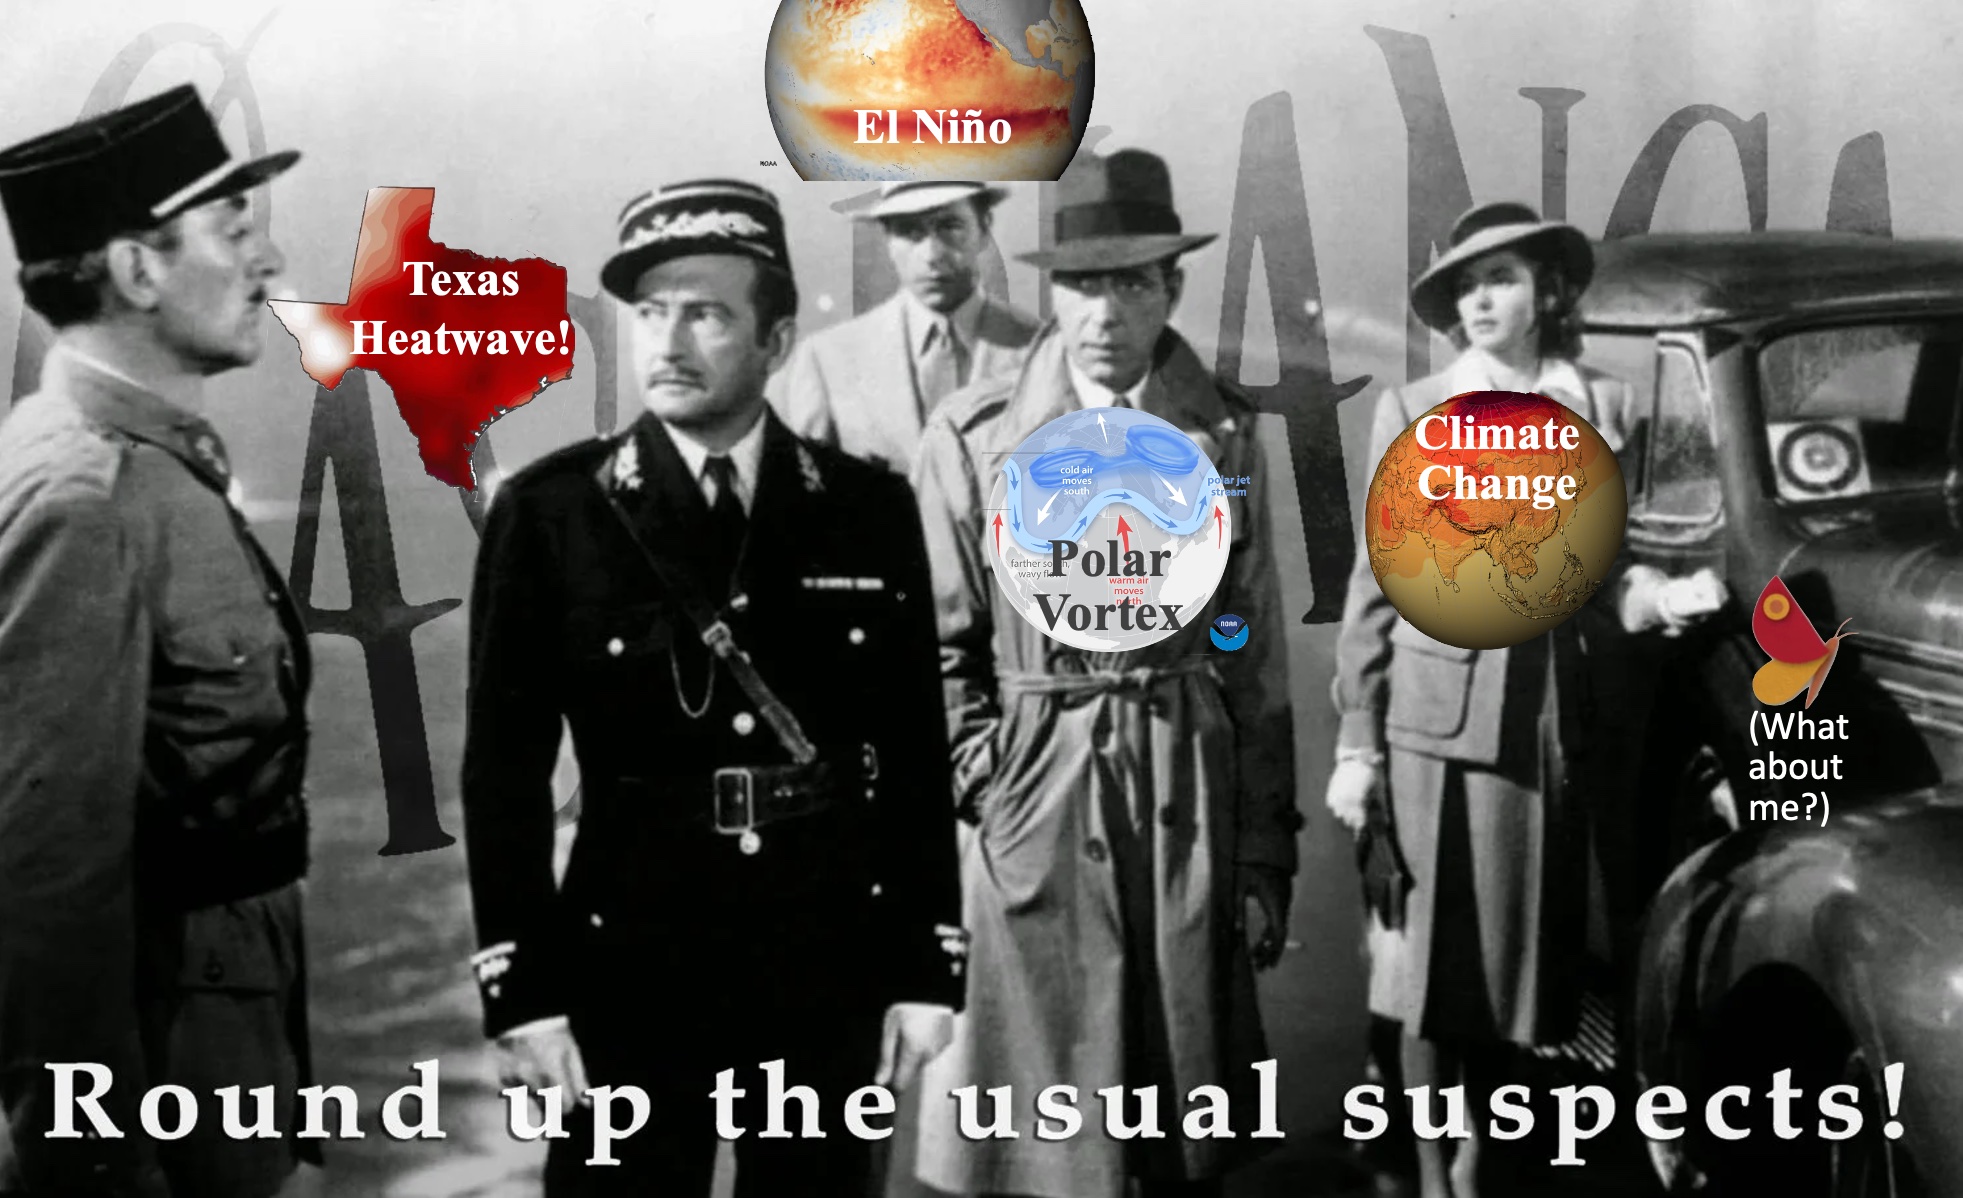
There’s a strong heatwave in Texas. Who’s to blame? Whodunit, or more precisely, whatdunit? Like the police captain in the movie Casablanca, the media reacted to the heatwave by rounding up a gallery of usual suspects:1 climate change, El Niño, wobbly jetstream, wavy polar vortex, and more. But what do the facts tell us? Is it a complex web of causes or just a couple of key factors?
Unlike murder mysteries and media musings, science focuses on simple explanations. The principle of Occam’s Razor says that we should look for the simplest explanation that fits all the facts,2 and ignore everything else as fluff. In the case of the Texas heatwave, the simple answer to the Whodunit question is3:
The Butterfly (Effect) did it, aided and abetted by climate change.
What about other “suspects” that may affect Texas heatwaves: warming because of El Niño, increased waviness of the polar vortex, or just increased thermal energy in the system due to climate change. Oftentimes, the additional explanations just add unnecessary complexity. Sometimes, they actually contradict the historical data!
I live in College Station, Texas, where the heatwave is hitting hard. I also lived through the extreme cold of Winter Storm Uri in 2021. This post is about Texas' extreme weather, which I’ve personally experienced, and its ties to climate change.
The Texas heatwave can be best explained by two concepts:
-
The Butterfly Effect (or chaos theory)4
-
Climate change (or global warming)
Chaos theorist Ed Lorenz famously asked the metaphorical question: Does the flap of a butterfly’s wings in Brazil set off a tornado in Texas?5 The question highlights how weather prediction is sensitive to small disturbances in initial conditions. The atmosphere is unstable, so little disturbances grow exponentially into large-scale weather phenomena. A heatwave is one such phenomenon, usually linked to long-lasting high pressure systems.6 One can explain a heatwave by blaming an wobbly jetstream or a wavy polar vortex. But, in essence, these are just elaborate ways of saying that a large-scale weather pattern causes local weather. It’s the small disturbances (like the metaphorical butterfly’s wing flap) that lead to these large-scale weather patterns and, hence, the heatwave.
The Butterfly Effect explains the cause of the heatwave. But it doesn’t tell us how long or severe it will be. That’s where factors like climate change come in. Let’s look at this using College Station, Texas, where I live, as an example.
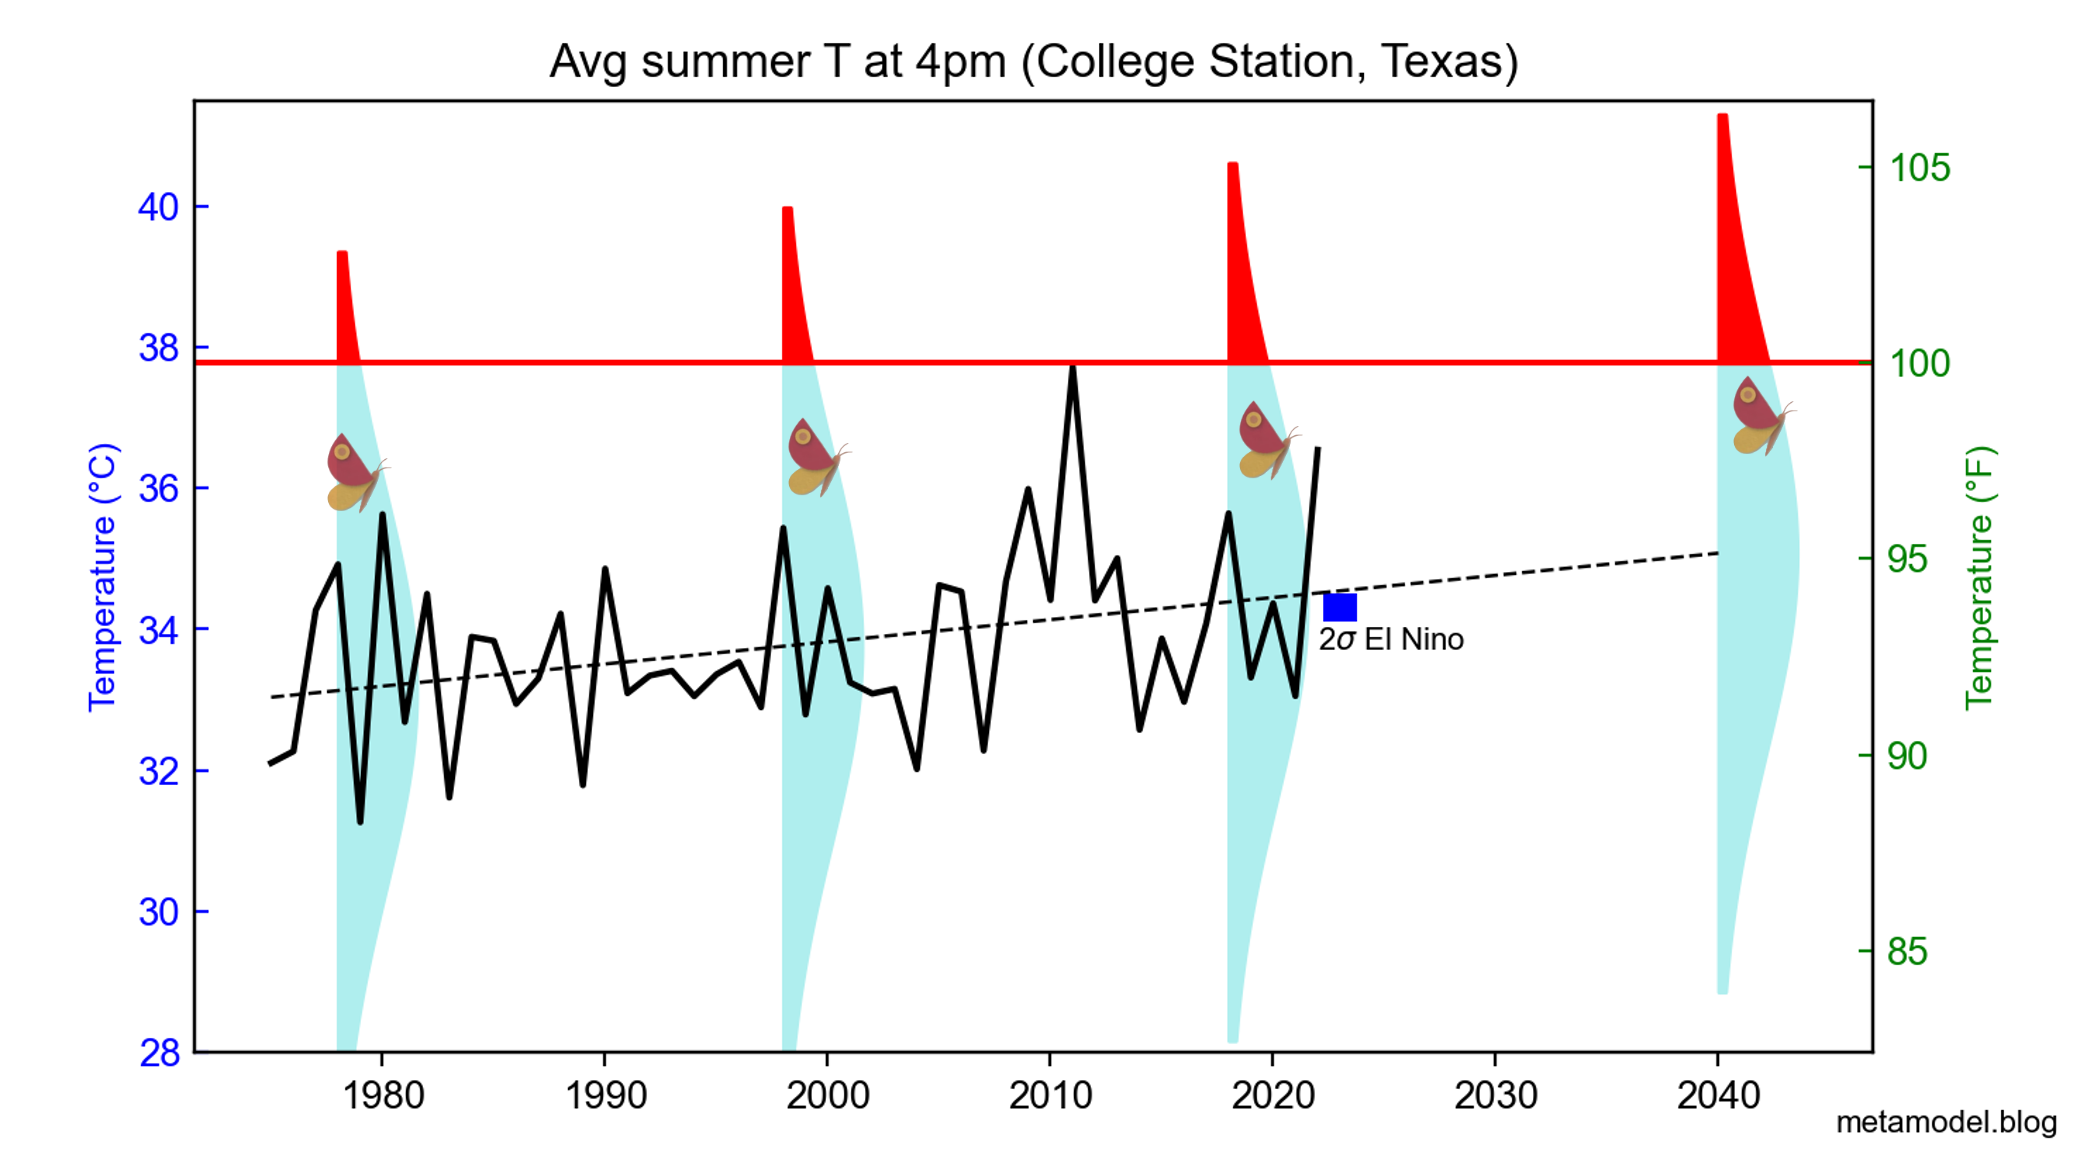
Figure 1 Average summer (Jun-Aug) surface (2m) temperature at 4pm for College Station, Texas (solid black line), with linear trend (dashed line). The turquoise area shows a schematic normal distribution for the range of daily weather variability, represented by the butterfly, with the red area showing days with temperature values exceeding 100°F. The small blue bar shows the cooling effect of a strong (2σ) El Niño, as estimated using linear regression. [From ERA5 reanalysis ]
In College Station, the average summer temperature at 4pm, typically the hottest part of the day, has gone up by about 1.5°C (2.7°F) since 1975 (Figure 1). A small change like this can significantly increase heatwave frequency because heatwaves are extreme events in the tail of the temperature probability distribution. Say a butterfly wing flap in 1975 triggered a 99°F heatwave. The same disturbance would trigger a 102°F heatwave in 2023. If we linearly extrapolate the current warming trend, the butterfly will likely trigger a 103°F heatwave by 2040.
The trend in heatwaves over College Station is typical of the general trend for heatwaves over Texas, as shown in Figure 2. This figure, like several others in this post, is taken from a detailed report on climate extremes produced by the Texas State Climatologist.7 According to the report, the “typical number of triple-digit days by 2036 is projected to be substantially larger, about 40% larger than typical values so far in the 21st century.”
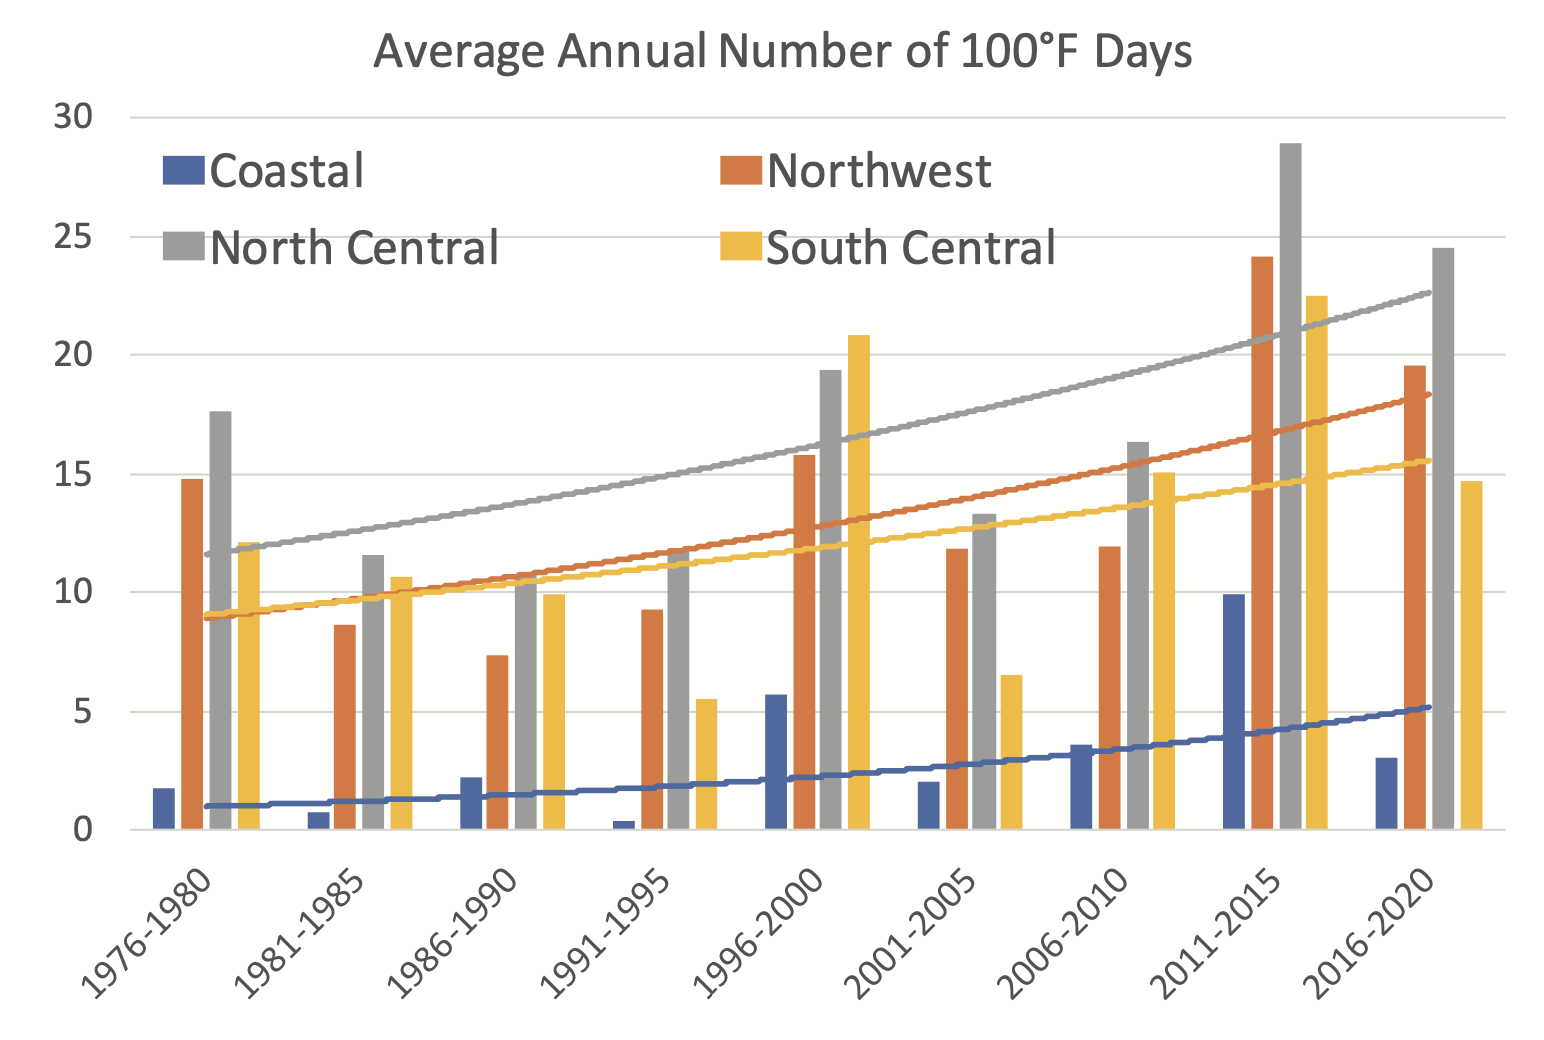 Figure 2 Trends and historic variability in index temperature stations in Texas. Trend lines are fit to the logarithm of 100 °F day counts to ensure non-negative values. [From Texas Climatologist Report]
The analysis in this post relies mostly on historical data. As a climate modeler well aware of the limitations of models, I wouldn’t recommend using them where one can rely on data instead. Yet, models are essential for linking historical warming to human activity and for predicting future climate change. At the end of this post, I discuss what your options are if—for whatever reason—you do not wish to use climate models even for that purpose.
How does global warming compare to Texas warming
Does El Niño make Texas heatwaves worse
Will increased thermal energy due to global warming make the weather more extreme
Is climate change making Texas temperature extremes more extreme
What if you are skeptical about climate models
How does global warming compare to Texas warming?
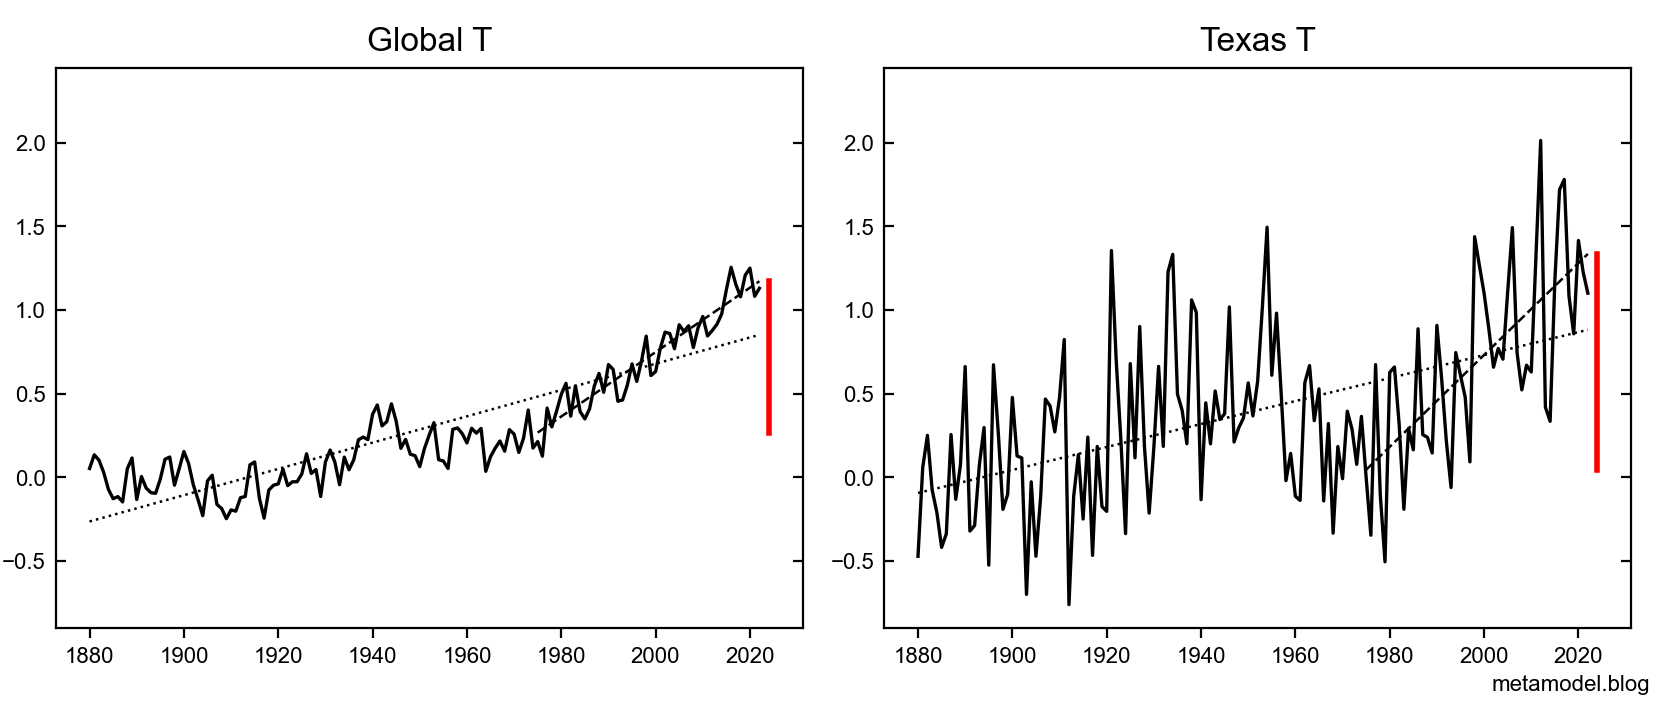
Figure 3 Global warming vs Texas warming: Annual average surface temperature averaged globally and over the Texas region (26-36N, 94-104W) [From NASA/GISTEMP]
When we compare global warming to Texas warming, we see some key differences (Figure 3). Globally, the warming trend is clear after 1970. Texas temperatures, on the other hand, vary a lot more from year to year. However, there is a stronger warming trend after 1970. The Butterfly Effect (or internal variability) is largely responsible for these regional variations. 8 When we look at global averages, we filter out a lot of this “noise”, as random variations in different regions balance each other out.
How much of the warming since 1970 can we attribute to human activity? We cannot use statistical analysis alone to answer this question, because the monotonic trend in human activities will correlate with just about any other monotonic trend. We need physics-based climate models to make this attribution. These models suggest that human actions caused over 80% of the recent warming (1975-2020) in Texas (Figure 4). They also predict that human-caused warming will continue for the next couple of decades at a rate similar to the recent trend (for a plausible future emission scenario, RCP 4.5). This confirms that the simple linear extrapolation used to predict the future of College Station heatwaves is consistent with climate model projections (Figure 1).
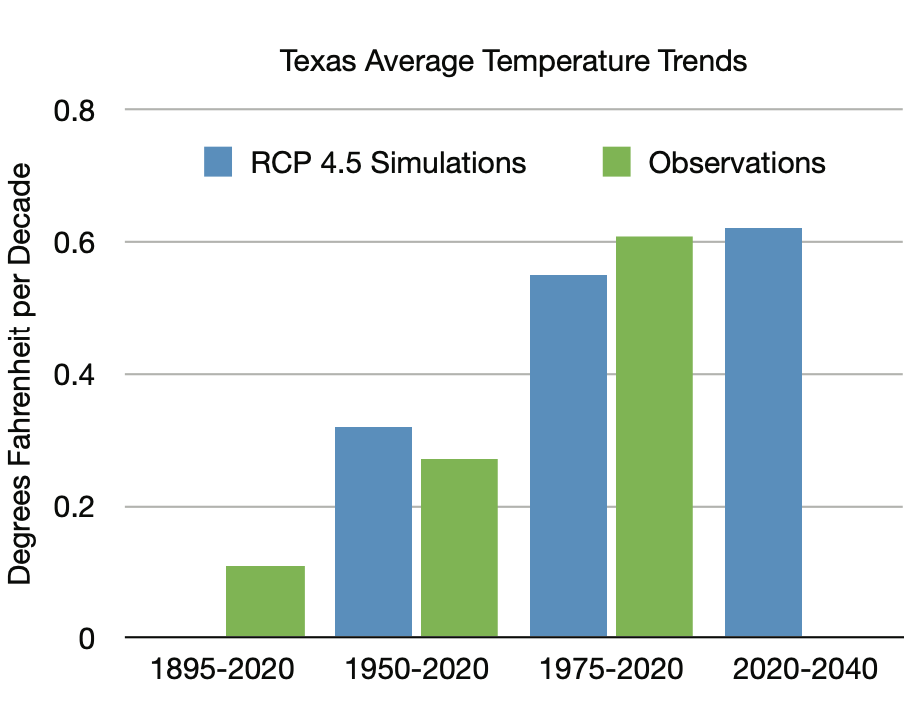
Figure 4 Simulated and observed surface temperature trends over Texas. [From Texas Climatologist Report]
Does El Niño make Texas heatwaves worse?
No, the idea that El Niño exacerbates Texas heatwaves is at odds with historical records. Past data indicates that El Niño actually cools Texas during summer, which would make heatwaves milder. A strong El Niño could decrease College Station’s temperature by about 0.4°C (0.7°F) (Figure 4). A prior post on this blog discusses why El Niño doesn’t always amplify heatwaves, even though it can increase the global average temperature.9 El Niño spreads out from the tropical Pacific as a dynamic wave effect, with alternating positive and negative signs of remote regional impacts. In contrast, global warming is a localized thermodynamic effect that tends to warm all regions.
Will increased thermal energy due to global warming make the weather more extreme?
As the earth heats up, the amount of thermal energy increases. Some argue that this makes all weather events more extreme, resulting in more severe heatwaves and cold spells. While this is a plausible argument motivated by physics, it only applies to homogeneous systems in statistical-mechanical equilibrium, where a single variable, temperature, characterizes the entire system. However, climate is an inhomogeneous system that is far from statistical-mechanical equilibrium. So there is no simple physical relationship between absolute temperature and its variability.
The instability in the atmosphere and resulting weather is mainly controlled by temperature gradients, not absolute temperature. Global warming is causing the poles to heat up faster than the equator, which reduces this gradient and could weaken weather systems. (However, factors like increased humidity and spatial inhomogeneity could counteract this to some extent.) The latest IPCC report10 shows that the coldest temperatures are not becoming more severe but are warming (Figure 5), as we might expect when surface temperature increases everywhere.
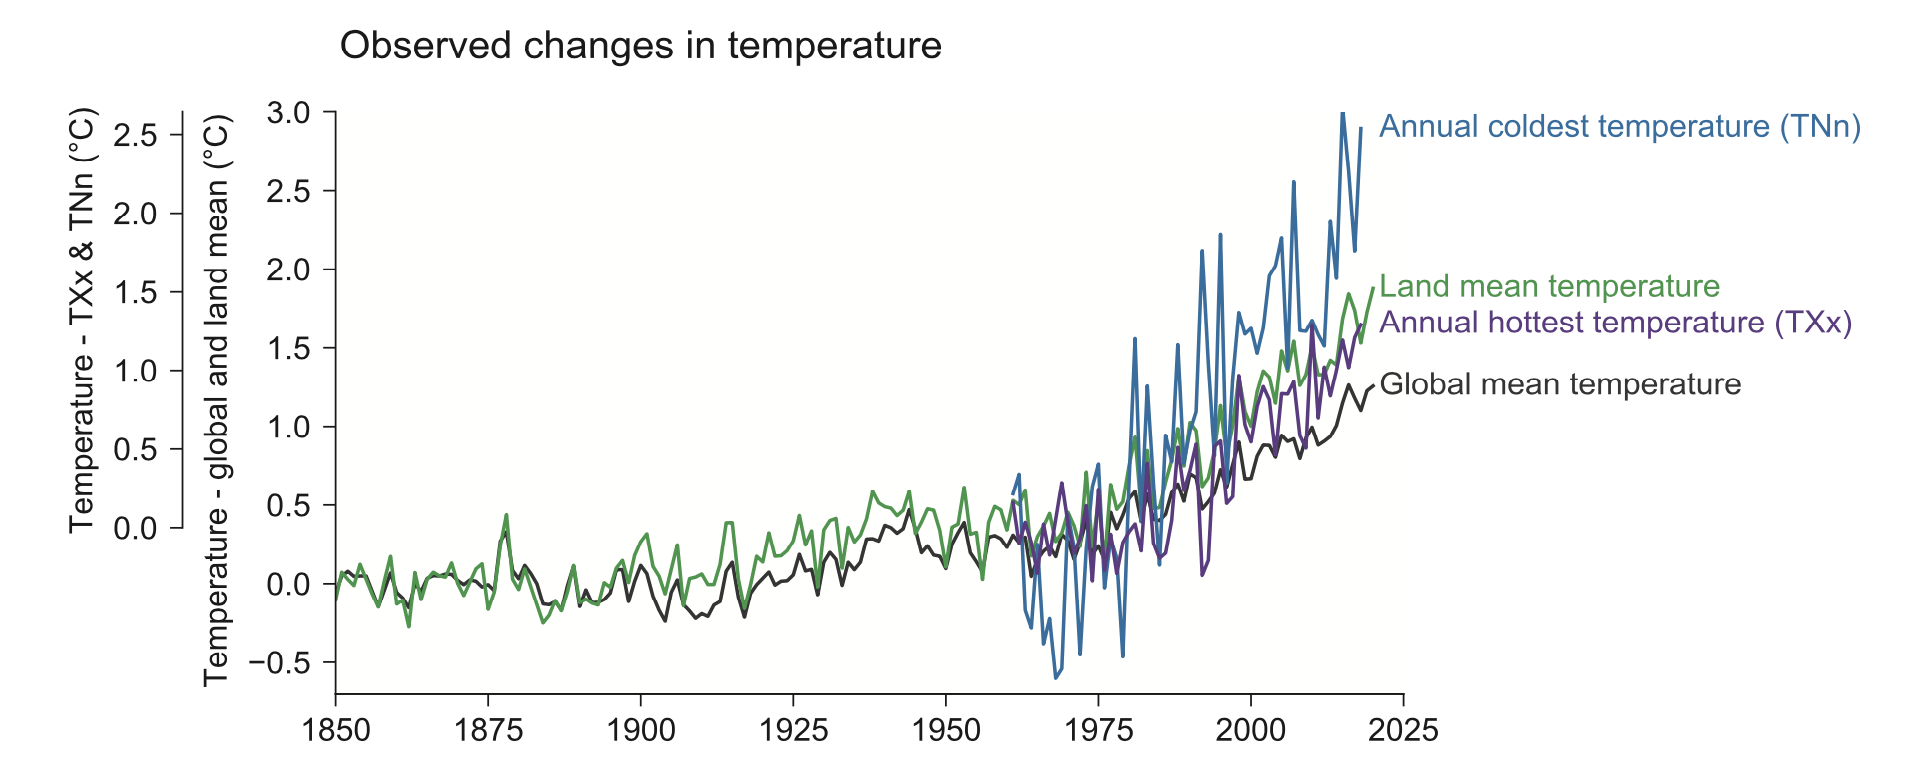 Figure 5 Time series of observed temperature anomalies for global average annual mean temperature (black), land average annual mean temperature (green), land average annual hottest daily maximum temperature (TXx, purple), and land average annual coldest daily minimum temperature (TNn, blue). [Figure 11.2 from IPCC AR6 WG1 Report]
Is climate change making Texas temperature extremes more extreme?
A prevalent theory suggests that global warming makes the polar vortex more wavy, resulting in extreme weather, both heatwaves and cold spells. That would mean that both the hottest temperatures and the coldest temperatures should set new records. But has this been happening in Texas?
According to the climatologist report, extreme hot summer temperatures in Texas have been increasing since 1975, but not as fast the average summer temperature (Figure 6). This means that the summer temperature probability distribution for College Station shown in Figure 1 may narrow slightly as Texas warms.
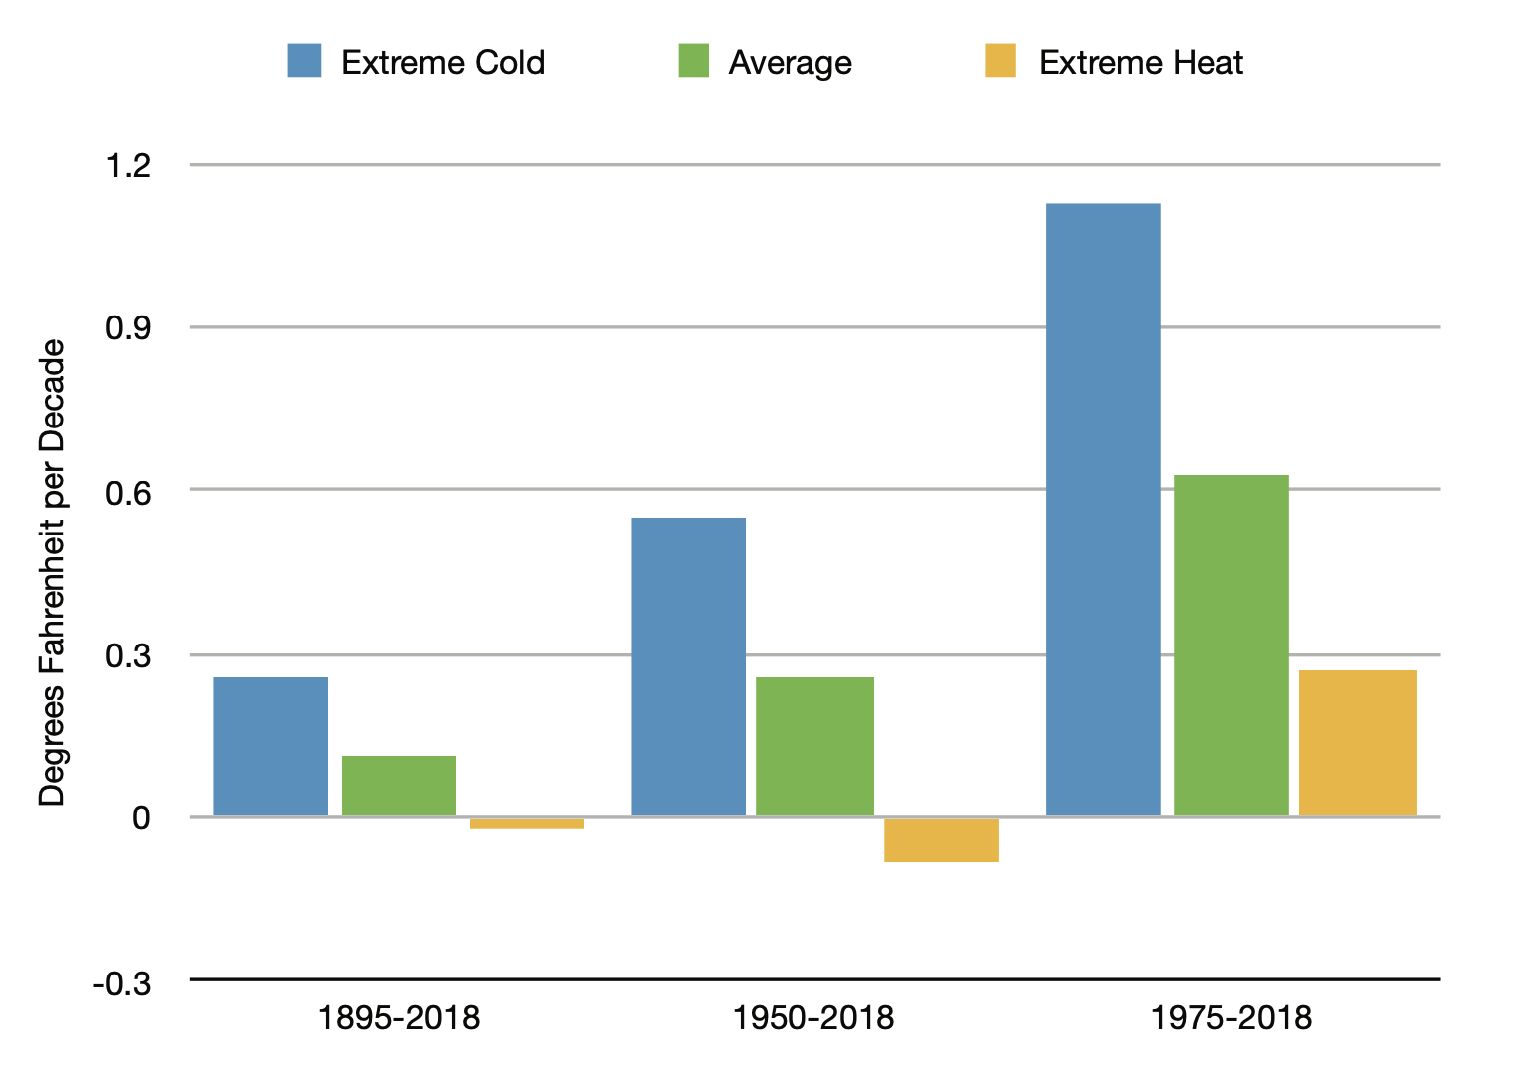 Figure 6 Comparison of the sizes of the trends in average temperatures and extreme heat and cold in the county data [From Texas Climatologist Report]
Meanwhile, the coldest winter temperatures in Texas are warming (Figure 6), similar to global trends (Figure 5). How then do we explain the occurrence of extreme Winter Storm Uri in 2021? Simple, the Butterfly Effect! Global warming didn’t cause Winter Storm Uri. On the contrary, the warming likely made the storm milder. Media continue to link such severe winter storms to climate change,11 but historical data from Texas refutes the idea that a wavier polar vortex is making winter temperature extremes more severe due to climate change.
What if you are skeptical about climate models?
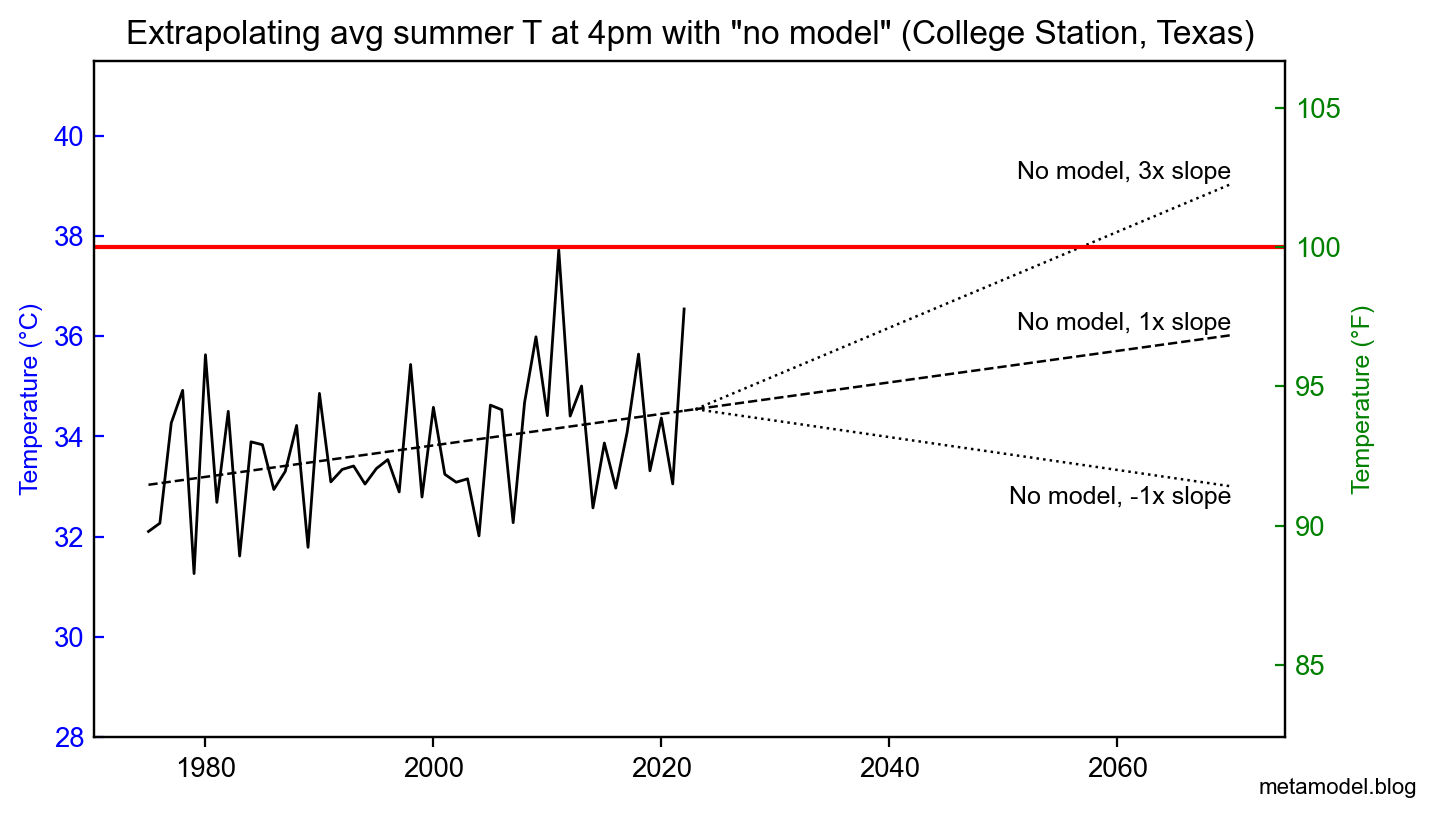
Figure 7 Variation of Figure 1 showing three hypothetical “no model” projections of the future: reversing the recent warming trend, sustaining it, or accelerating the trend.
If you’re skeptical about climate models, consider that Texas’s climate is changing, with a clear warming trend and an increase in 100-degree days over the past 50 years (Figure 2). How do you plan for the future without relying on climate models? You need to consider the possibility that the warming trend could reverse, continue, or even accelerate, as shown in Figure 7.
You may think Figure 7 doesn’t use a model, but it is actually using a simple statistical model. The point is that any planning requires a prediction model. The only way to avoid models altogether is not to think about the future at all!
If you want to plan for the future, there are basically two options:
-
Reductionist physics-based models: Reductionist models, like the ones used by IPCC, break the complex climate system into components, and handle each component separately. These models aren’t perfect; they have uncertainties and biases. However, their components and their combined predictions are validated against data. We can test the components using short-term measurements, without the need for centuries of validation data.
-
Emergent statistical models: Emergent models try to predict climate properties like temperature statistically, without breaking the climate system down into pieces. These models will necessarily be crude, like the one shown in Figure 7, because we have limited historical data to validate them. Climate varies across many timescales, from decades to millennia, and we have reliable data only for about a century or so.
Simple statistical models may be adequate for short-term climate predictions of up to a decade or so. (They may even be preferable to the physics-based models in some cases because they avoid simulation biases.) In the longer term, though, statistical models will not capture the nonlocal and nonlinear interactions that affect climate, including the projected impact of changing human activities.
Finding flaws in physics-based climate models isn’t hard, but there is no better alternative for long-term prediction. How much should we trust the predictions from physics-based models? As Figure 7 shows, the worst-case scenario using a crude statistical model could be more severe than those predicted by the IPCC climate models. Physics-based models, for all their imperfections, are subject to strict energy and mass constraints that limit the range of future climate changes. Poorly validated extrapolative statistical models are not so constrained.
-
Warning of unprecedented heatwaves as El Niño set to return in 2023 (The Guardian), Global heat waves show climate change and El Niño are a bad combo (NPR), The unusual factors behind the extraordinary heat across the southern US (Vox.com) ↩︎
-
Occam’s (or Ockham’s) razor is a principle attributed to the 14th century logician and Franciscan friar William of Ockham: Pluralitas non est ponenda sine neccesitate, or Entities should not be multiplied unnecessarily (UCR.edu) ↩︎
-
Ch.7, The Climate Demon: Past, Present, and Future of Climate Prediction (ClimateDemon.com) ↩︎
-
Is the weather actually becoming more extreme? (TED.com), The Butterfly Effect: Everything You Need to Know About This Powerful Mental Model (FS.blog) ↩︎
-
When the Butterfly Effect Took Flight (MIT Technology Review) ↩︎
-
Anatomy of a heat wave (theclimatebrink.substack.com) ↩︎
-
Assessment of Historic and Future Trends of Extreme Weather in Texas, 1900- 2036, 2021 Update. Document OSC-202101 (J Nielsen-Gammon et al., 2021:, Office of the State Climatologist, Texas A&M University) ↩︎
-
Strange weather in the multiverse of climate (Metamodel.blog) ↩︎
-
Who’s afraid of the Big Bad El Niño? (Metamodel.blog) ↩︎
-
“Widespread observed and projected increases in the intensity and frequency of hot extremes, together with decreases in the intensity and frequency of cold extremes, are consistent with global and regional warming.” p.1523, IPCC AR6 WG1 Report ↩︎
-
The Texas Power Grid Failure Is a Climate Change Cautionary Tale (TIME.com) ↩︎