
Hurricane Fed: The New Climate Stress Test for Banks
R. Saravanan
P#9 • ePUB • PDF • 11 min • comments
Recently, the US Federal Reserve (“Fed”) issued guidance for a pilot exercise on how the six largest US banks should analyze their exposure to climate risk.1 The Fed calls the study exploratory and says the results will have no capital implications. Nevertheless, this exercise is essentially a climate stress test—like the financial stress tests to check whether banks have enough capital to survive economic shocks. Other central banks around the world are taking similar steps. Climate change can lead to increased economic risk. Planning to deal with this risk, taking into account all the uncertainties, is prudent for the Fed and other central banks to advocate.
The Fed proposes a probabilistic assessment of the risk of an extreme hurricane event making landfall in the Northeast US in 2050 under two different carbon emission scenarios: a medium emission scenario, RCP4.5 and a high-emission scenario, known as RCP8.5. This sounds straightforward at the surface, but when you dig deeper the proposed assessment turns out to be quite complicated, involving many assumptions.
Predicting future climate and economic conditions requires using complicated models and scenarios. However, this doesn’t mean that risk assessment needs to be framed in a convoluted fashion. When we ask bankers (and other lay people) to test for climate risk, it would be best provide guidance in the simplest terms possible. The Fed’s risk estimation exercise fails the stress test of simplicity. As explained later in this article, a better way for banks to assess climate risk would be to use a simple “storyline approach” with a few well-defined assumptions about future climate change.
Problems with the Fed’s guidance
In January 2023, the Fed issued instruction for the Pilot Climate Scenario Analysis Exercise2, which asks the banks to assess physical climate risk in the following manner:
[F]or the iterations of the common shock component, participants should estimate the impact of a hurricane event(s) within the Northeast region with the following characteristics:
Climate conditions broadly consistent with possible future climate conditions in 2050 as characterized by the SSP2-4.5 (or RCP 4.5) pathways with a 100-year return period loss…
Climate conditions broadly consistent with possible future climate conditions in 2050 as characterized by the SSP5-8.5 (or RCP 8.5) pathways with a 200-year return period loss…
Climate conditions broadly consistent with possible future climate conditions in 2050 as characterized by the SSP5-8.5 (or RCP 8.5) pathways with a 200-year return period loss…
To estimate the impact of the hurricane event(s) in 2050 across the three iterations above, participants may need to make additional assumptions around the state of climate and the related chronic physical features in 2050, including, but not limited to, an increase in surface temperatures, sea level rise, and precipitation levels.
Taken at face value, this sounds like the right approach. The Fed’s reasoning appears to rest on the following chain of assumptions: (i) risk assessments should be based on probabilities; (ii) extreme weather is expected to worsen with climate change; (iii) considering climate in a specific region rather than global average climate makes the assessment relevant to the US; (iv) decadal timescales are more important for financial risk than centennial timescales; and (v) different emission scenarios allow us to span the range of policy responses.
Most people’s intuition about climate change is based on the popular discourse on climate change, which often focuses on the global average temperature increasing over centuries. There is a clear separation of the global warming signal on centennial timescales as predicted by climate models for different emission scenarios—the globe will be much warmer under RCP8.5 than RCP4.5 by the year 2100. There is always random noise associated with unpredictable (“stochastic”) variations associated with weather, but it is relatively small when temperature is averaged globally, because of cancellations amongst regional variations.3
However, nobody lives in “global-average-land”! While global warming thresholds of 1.5 (or 2.0)°C dominate newspaper headlines, what will affect your life is the warming in the region you live in. In the middle latitudes, the regional greenhouse gas warming signal remains roughly the same as the global warming signal, but the random noise will be a lot stronger, because the cancellation benefit of global averaging is lost. That makes it much harder to discern the regional warming signal. If we are interested in short-term warming (by year 2050, say), the warming signal becomes even weaker whereas the noise amplitude remains the same (Figure 1).
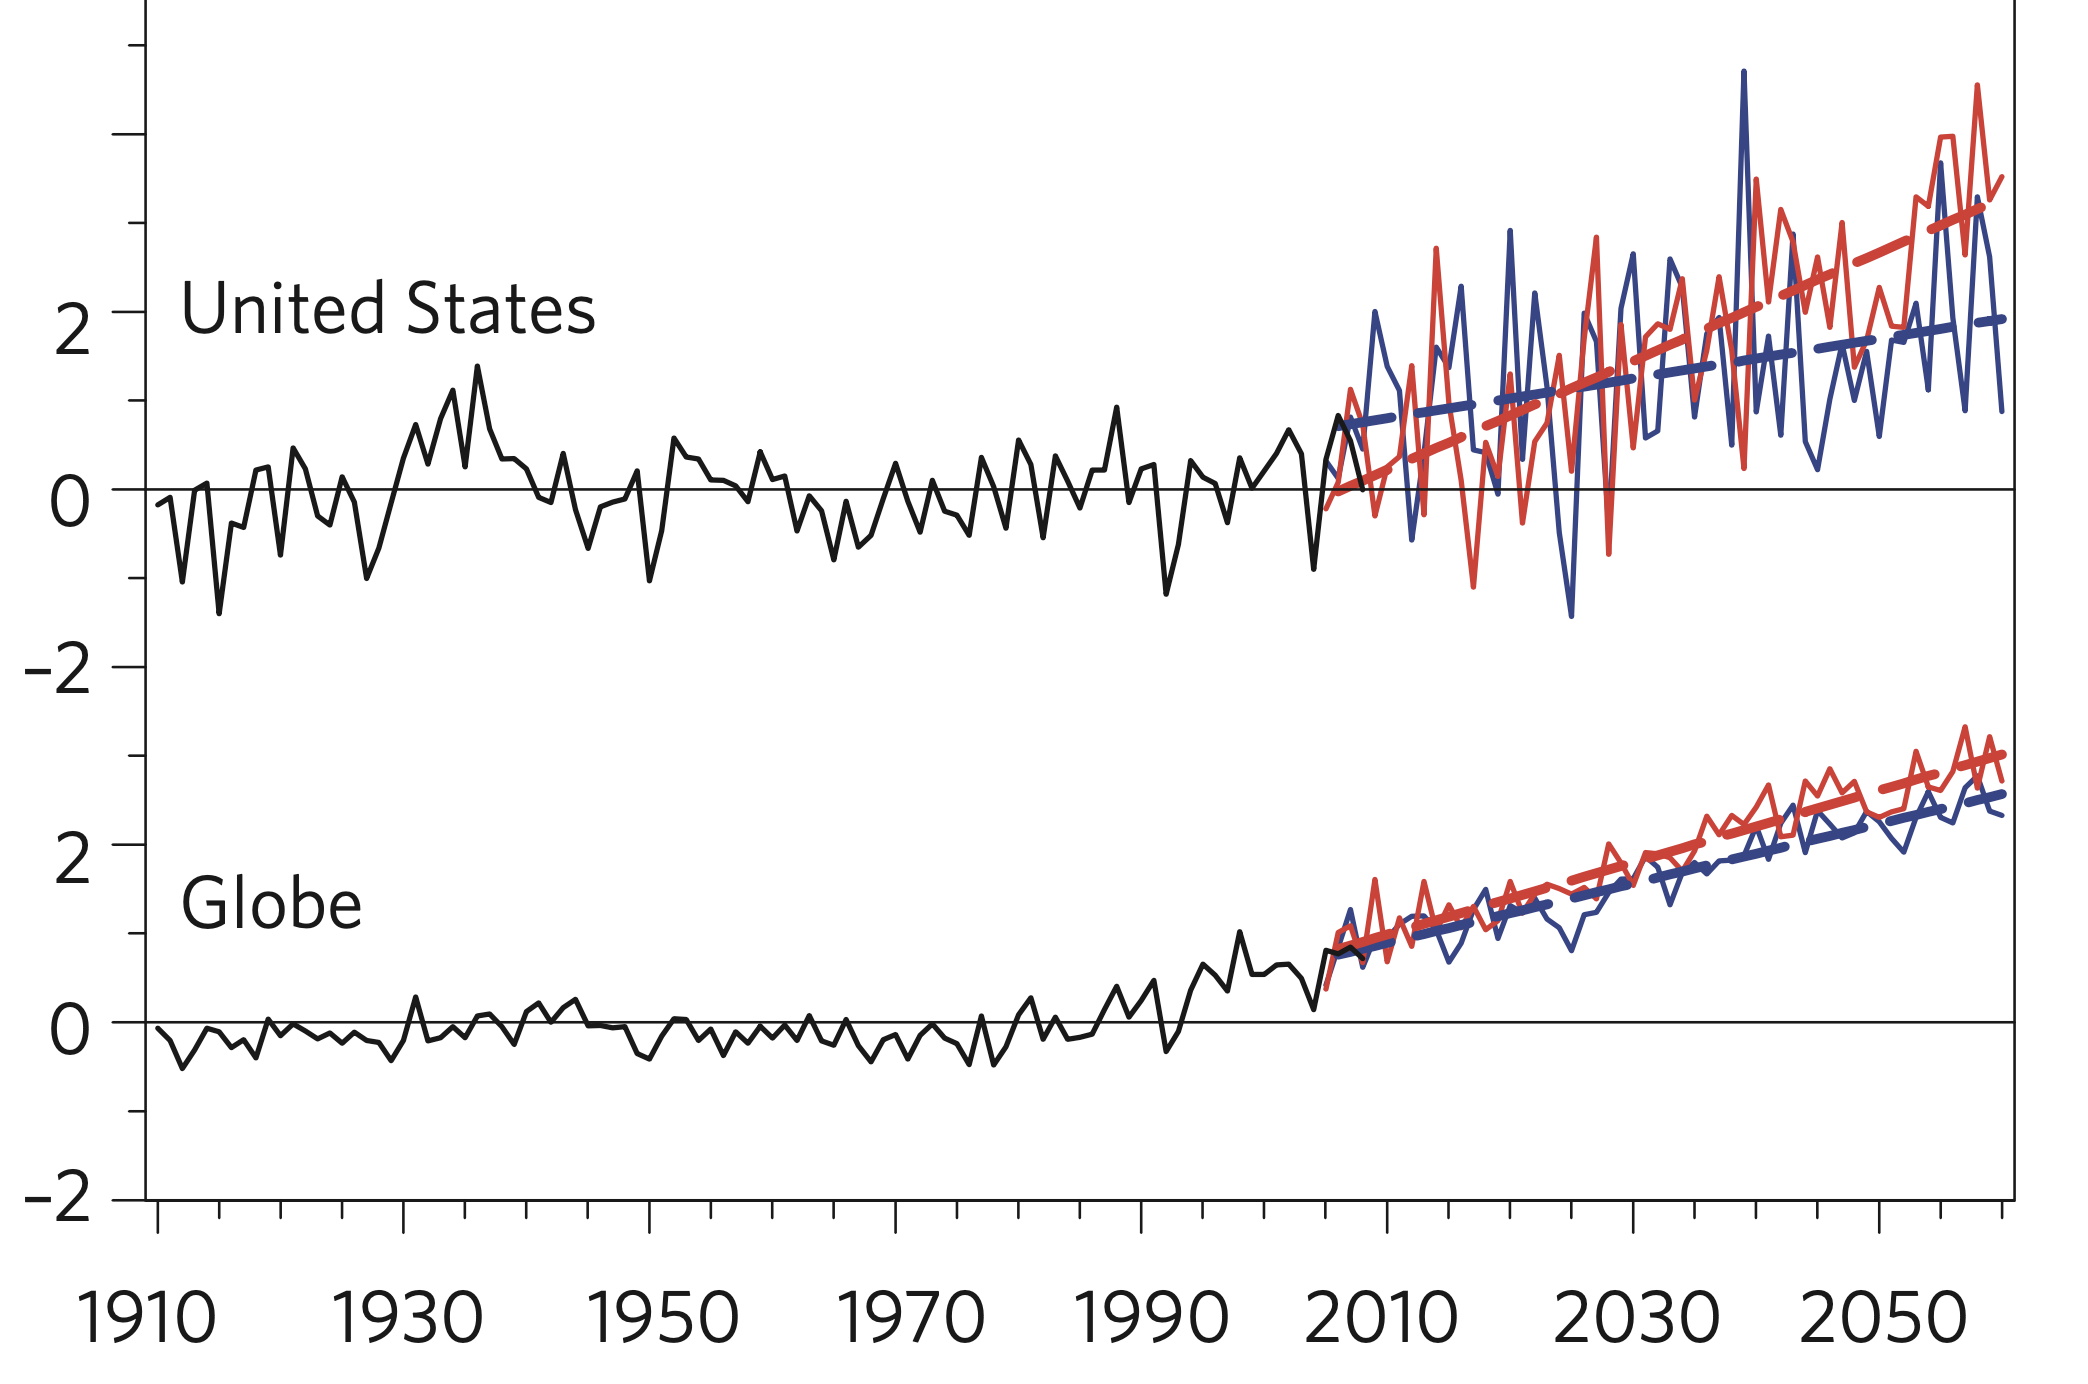 Figure 1 Temperature change averaged over the globe and over the contiguous United States in observations until 2008 (black) and for a single emission scenario (A1B; similar to RCP6.0) until 2060, for the weather realization with the largest (red) and smallest (blue) future trends. The smaller the averaging region, the larger the random noise due to weather. [Adapted from Figure 2b of Deser et al., 2020]4
The popular discourse on climate change also leaves the impression that just because we have models that predict future global warming, we can compute precise probabilities of all future extreme events like heat waves, heavy rainfall or hurricanes. Climate models simulate different phenomena with differing degrees of realism. Large-scale warming patterns and heat waves are simulated better than small-scale rainfall events. Uncertainties associated with different climate models make it hard to estimate precise future probabilities of regional extreme rainfall, for example (Figure 2).
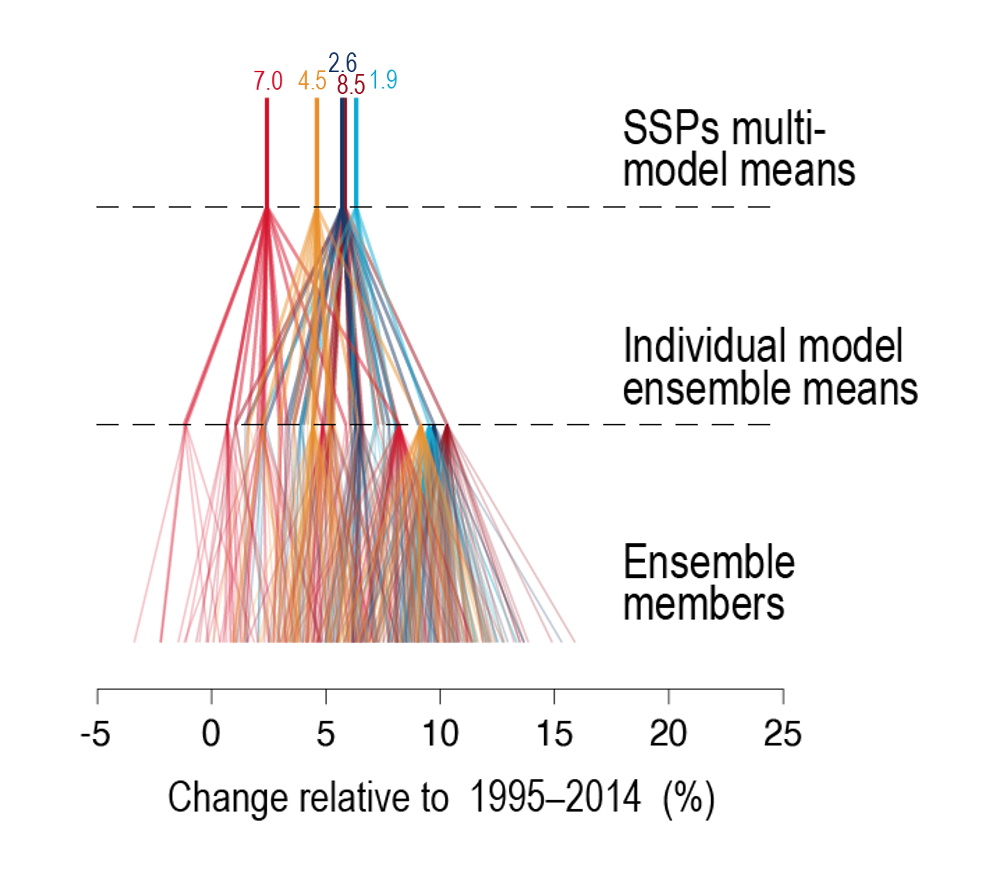 Figure 2 Cascading uncertainties in IPCC model projections of East Asia summer (June-August) rainfall for multiple emission scenarios (SSP 1.9, 2.6, 4.5, 7.0, 8.5) for years 2041-2060. Top row shows average for each SSP; next row shows the average for individual models; bottom row shows the rainfall for each individual realization of weather in each model (representing the random variability). It is hard to distinguish between emission scenarios 4.5 and 8.5 when looking at the spread of simulated rainfall in the year 2050. Interestingly, the lowest emission scenario, 1.9, shows the largest rainfall changes in the near term due to the effect of aerosols in that scenario. [Adapted from Figure 1.15 of IPCC AR6 WG1 report]5
With the above caveats in mind, we focus on weak links in the chain of assumptions (i)—(v) that underlie Fed’s guidance.
(i) Risk assessments should be based on probabilities. By specifying numeric probabilities (e.g., 100-year return period loss), the Fed aims to make the risk assessment precise. That would work if we knew the precise probabilities of hurricanes making landfall in the Northeast US in the year 2050. But we don’t. Our current global climate models have too coarse spatial resolution to estimate the precise probability of future hurricane landfalling events. The current horizontal grid of climate models is at best about 50kmX50km—not enough to resolve the eyewall of a hurricane. Making additional assumptions and using simpler/regional models, we can come up with numbers for future hurricane probabilities, but the answers will be sensitive to the assumptions.6
(ii) Extreme weather is expected to worsen with climate change. This statement is generally true, but the devil is in the details. Large-scale weather extremes like heat waves will uniformly get worse but the picture is more complicated for hurricanes because they involve small-scale moist processes. According to our current scientific understanding, the strength of hurricanes and the associated rainfall are expected to increase but their total number may actually decrease (Figure 3). The strongest hurricanes are expected to get even stronger and may increase in number. If the total number of hurricanes does not increase, it implies that weaker hurricanes, such as Category 1 or 2, will decrease in number.
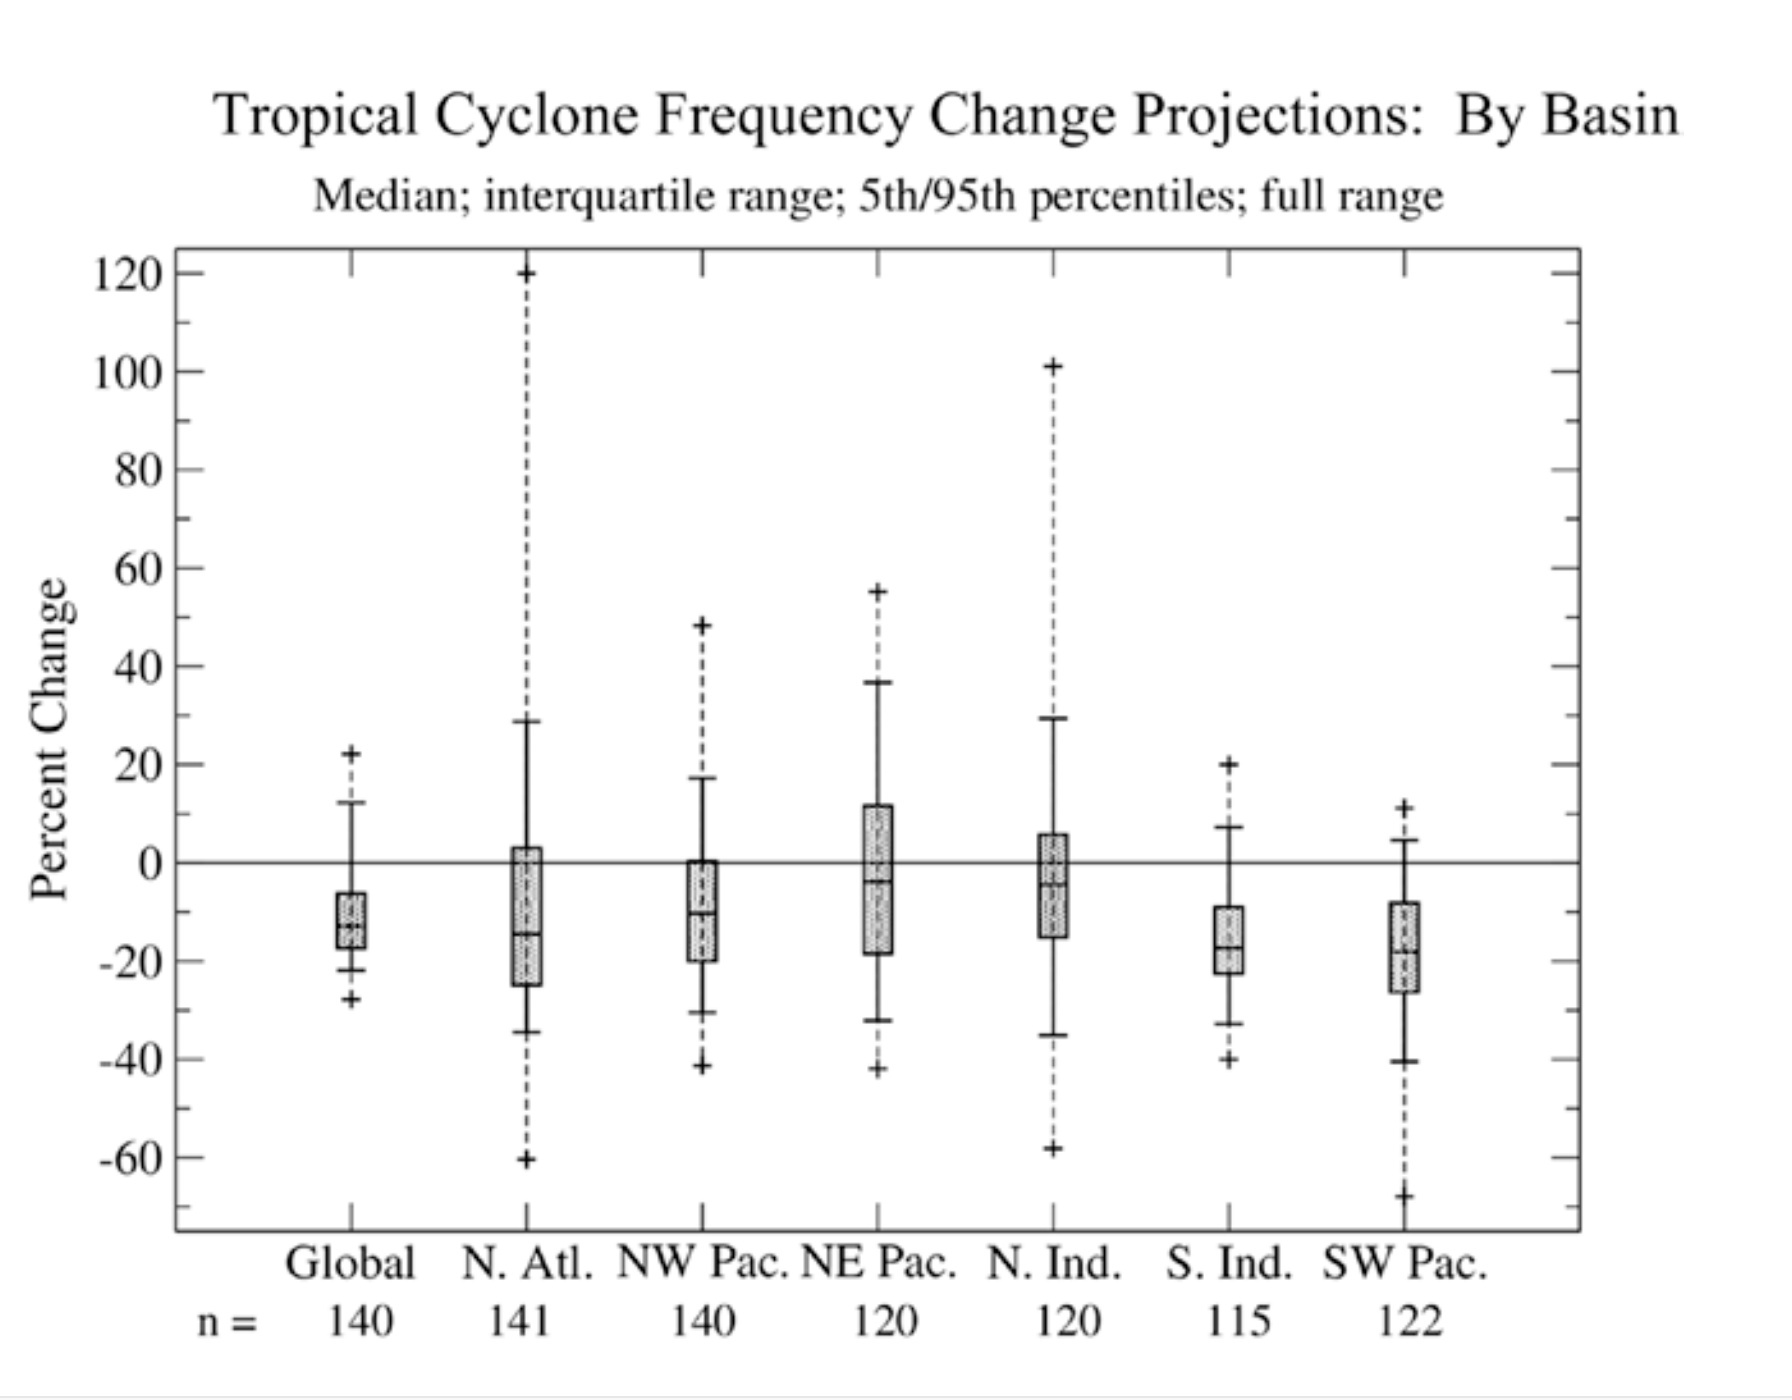 Figure 3 Projected changes in the frequency of tropical cyclones (known as hurricanes in the North Atlantic) for each ocean basin for 2°C of additional global warming compared to current conditions. Hurricane frequency in the North Atlantic is projected to decline about 15% on the average, but the uncertainty range is huge! [Adapted from Fig. 1b of Knutson et al., 2020]7
The Fed’s choice to focus on an extreme hurricane affecting the Northeast US is presumably motivated by an actual natural disaster, Hurricane Sandy, that wreaked havoc in that region in October 2012, killing hundreds of people and inflicting many tens of billions of dollars in damage.8 But Sandy was not very strong, as hurricanes go; it barely reached a peak intensity of Category 3 and made landfall as a Category 1 storm. Bankers may be surprised to learn that climate change might actually make weak storms like Sandy rarer in the future.
Of course, a stronger hurricane than Sandy could impact the Northeast in the near future. Such a rare event could happen purely by chance, even in the absence of additional warming between now and 2050. Future global warming could be responsible for amplifying the storm, but the distinction between different emission scenarios may not be very discernible by the year 2050.
(iii) Considering climate in a specific region rather than global average climate makes the assessment relevant to the US. Yes, but the regional focus also greatly increases the strength of random (stochastic) noise as discussed earlier. To probabilistically assess regional climate change for a small area like the Northeast US, we would need a large ensemble of climate model simulations to quantify the random noise9 — something the Fed’s guidance fails to note.
(iv) Decadal timescales are more relevant for financial risk than centennial timescales. True, but focusing on shorter timescales means the global warming will be weaker and less sensitive to the scenario being considered. Coupled with the much larger amplitude of random variability, as noted in the (iii) discussion, there may be no point in trying to distinguish between the signals of RCP8.5 vs. RCP4.5 by 2050, as the Fed recommends.
(v) Different emission scenarios allow us to span the range of policy responses. Yes, but it would become a moot issue with the lower signal-to-noise ratio, as noted in the discussion of points (iii) and (iv) above.
The Fed’s guidance may sound well-defined and numerically precise on the surface, but it isn’t quite so. The numerical precision of the specified return period loss becomes irrelevant if our estimates of the probability of the physical hazard, i.e., future landfalling hurricanes, are themselves imprecise. Since banks are free to make numerous additional assumptions needed to estimate the physical hazard, the guidance is poorly formulated. Even seemingly small errors in these assumptions can lead to big errors in the estimation of tail risk of the physical hazard.10 The uncertainties associated with the assumptions can be lost in translation, leading to faux precision in the final risk assessment.
The super-Sandy storyline
Since climate risk is real and important, is there is a better way to assess its impact on the banking sector? One that does not involve hard-to-compute probabilities and a multitude of assumptions? Instead of hiring consultants to make many small assumptions involving a cascade of models that we can’t keep track of, can’t we just make a few big assumptions? Wouldn’t it be more transparent if we are upfront about the uncertainties?
An alternative, and simpler, way to frame the risk assessment is to start with a known extreme event, say Hurricane Sandy that affected the Northeast US in 2012, and ask how a stronger version of this storm occurring in the near future would affect bank finances. Such an approach, often referred to as a “storyline”, is better suited to describing future high-impact low-likelihood events whose probabilities are hard to quantify.11
Scientific research shows that global warming amplifies the water cycle, meaning that extreme storms like Sandy can become more intense as the atmosphere becomes moister. One can assess the financial risks of a stronger “super-Sandy” hurricane, say 10% stronger than Sandy, making landfall in the Northeast US. Such an assessment should also include estimates of higher sea-levels by the year 2050, which would amplify the coastal impacts.
The storyline framing possesses several advantages. It sidesteps the contentious issue of whether the high-emission RCP8.5 scenario—required by the Fed—is even a plausible future.12 According to the latest international climate assessment from the IPCC, recent trends in the energy sector mean that the likelihood of the RCP8.5 scenario is low. The storyline framing focuses on the narrower question of whether a super-Sandy storm impacting the Northeast US by 2050 is a plausible event. The combination of climate change and random variability can make such an event plausible. (If need be, we can consider different plausible strengths of super-Sandy to span the range of physical risk.)
The current Fed proposal allows the use of a la carte assumptions to assess climate risk. Banks may end up making different modeling assumptions. A smorgasbord of assumptions will mean that comparing risk assessments from different banks will be like comparing apples to oranges. A simpler alternative is to assess financial impacts using a well-defined storyline with fewer assumptions. That can provide a clearer picture of the climate risk faced by banks.
Keep it simple, Fed!
(Top image shows a NASA satellite view of Hurricane Sandy approaching the Northeast US on October 29, 2012, with the Federal Reserve logo in the eye of the storm.)
-
Explaining the Fed’s climate test (EEnews.net) ↩︎
-
Pilot Climate Scenario Analysis Exercise (FederalReserve.gov) ↩︎
-
What to expect when you’re expecting a better climate model, Fig. 3 (Metamodel.blog) ↩︎
-
Communication of the role of natural variability in future North American climate (C. Deser et al., 2012; Nature Climate Change) ↩︎
-
IPCC AR6 WG1 report, Chapter 1: Framing, Context and Methods, p.198 ↩︎
-
IPCC AR6 WG1 report, Chapter 11: Weather and Climate Extreme Events in a Changing Climate, p.1588 ↩︎
-
Tropical cyclones and climate change assessment part II: projected response to anthropogenic warming. (T. Knutson et al., 2019; Bulletin of the American Meteorological Society) ↩︎
-
Sandy and Its Impacts (NYC.gov) ↩︎
-
Strange weather in the multiverse of climate (Metamodel.blog) ↩︎
-
The perils of predicting perils: (mis)calculating wet-bulb temperature (Metamodel.blog) ↩︎
-
Storylines: an alternative approach to representing uncertainty in physical aspects of climate change (T.G. Shepherd et al., 2018; Climatic Change) ↩︎
-
Emissions – the ‘business as usual’ story is misleading (Z. Hausfather and G.P. Peters, 2020; Nature) ↩︎