
The perils of predicting perils: (mis)calculating wet-bulb temperature
R. Saravanan
P#5 • ePUB • PDF • 10 min • comments
Is life worth living? It depends on the liver. So goes the old joke. Is life worth living in a warming climate? The answer might be: It depends on the wet-bulb temperature. Like the state of the liver determines whether you can drink alcohol, the value of the wet-bulb temperature determines whether you can survive without air conditioning — if the value exceeds 35°C, you just cannot.
Wet bulb temperature is an obscure meteorological metric that has gained prominence lately because it measures human survivability. Many recent media articles, such as this one in The Economist, use wet-bulb temperatures to characterize the severity of heat waves.1 Kim Stanley Robinson’s cli-fi novel, The Ministry for the Future, begins with a graphic description of a lethal heat wave in India with a high wet-bulb temperature.2
Wet-bulb temperature can provide many useful insights, but is complicated to calculate. A seemingly small (and innocuous) mistake in the calculation can have a big impact on risk estimation. This may have been the case with a high-profile report on climate change issued by the international consulting company McKinsey in 2020.3 The report predicted that by 2030 that hundreds of millions people could be living in regions that will experience heat waves that threaten human survivability (under a particular emission scenario). The fine print in the report details a crucial assumption about how wet-bulb temperature was calculated. If that assumption is incorrect, it could affect the conclusions of the report.
At the time McKinsey report was released, I was writing a book about climate prediction.4 I decided to use a quote from the report in my book as an example of climate risk assessment. I did not evaluate the claims in the report or read the fine print. I was merely using the quote to make the point that such reports are very influential. But about a week ago, climate scientist Patrick Brown tweeted about a potentially serious flaw in the methodology of the McKinsey report.5 You can read that tweet thread for more details and background information. These tweets motivated me to re-examine the report and also learn more about wet-bulb temperature.
Wet-bulb temperature
What is wet-bulb temperature? It is literally the temperature measured by a special thermometer that has a “wet bulb” — the bulb is the portion of the thermometer that senses temperature. A normal thermometer has a dry bulb. A wet-bulb thermometer has a bulb covered with a wet cloth, which is analogous to a human body that is sweating. As the sweat evaporates, it cools the body and therefore it feels cooler than the temperature of the surrounding air. The wet-bulb thermometer essentially measures how cool it feels, sort of like a heat index.
The wet-bulb temperature is always cooler than the actual air temperature. How much cooler depends upon how humid the surrounding air is. If the air is dry, water can evaporate easily, cooling the thermometer. When the humidity approaches 100%, the wet-bulb temperature will approach the air temperature, because water can no longer evaporate as the air becomes saturated with moisture.
Why all the recent interest in this somewhat arcane meteorological measure? It’s because wet-bulb temperature has implications for outdoor activity and survivability of humans.6 As warm blooded creatures, we continuously generate heat that must be expelled to maintain our body temperature at 37°C (98.6°F). When the air is cool or dry, sweating allows us to do just that. The opposite of “cool or dry” is “hot and humid”. When it is hot and humid, sweating becomes inefficient as a heat loss mechanism.
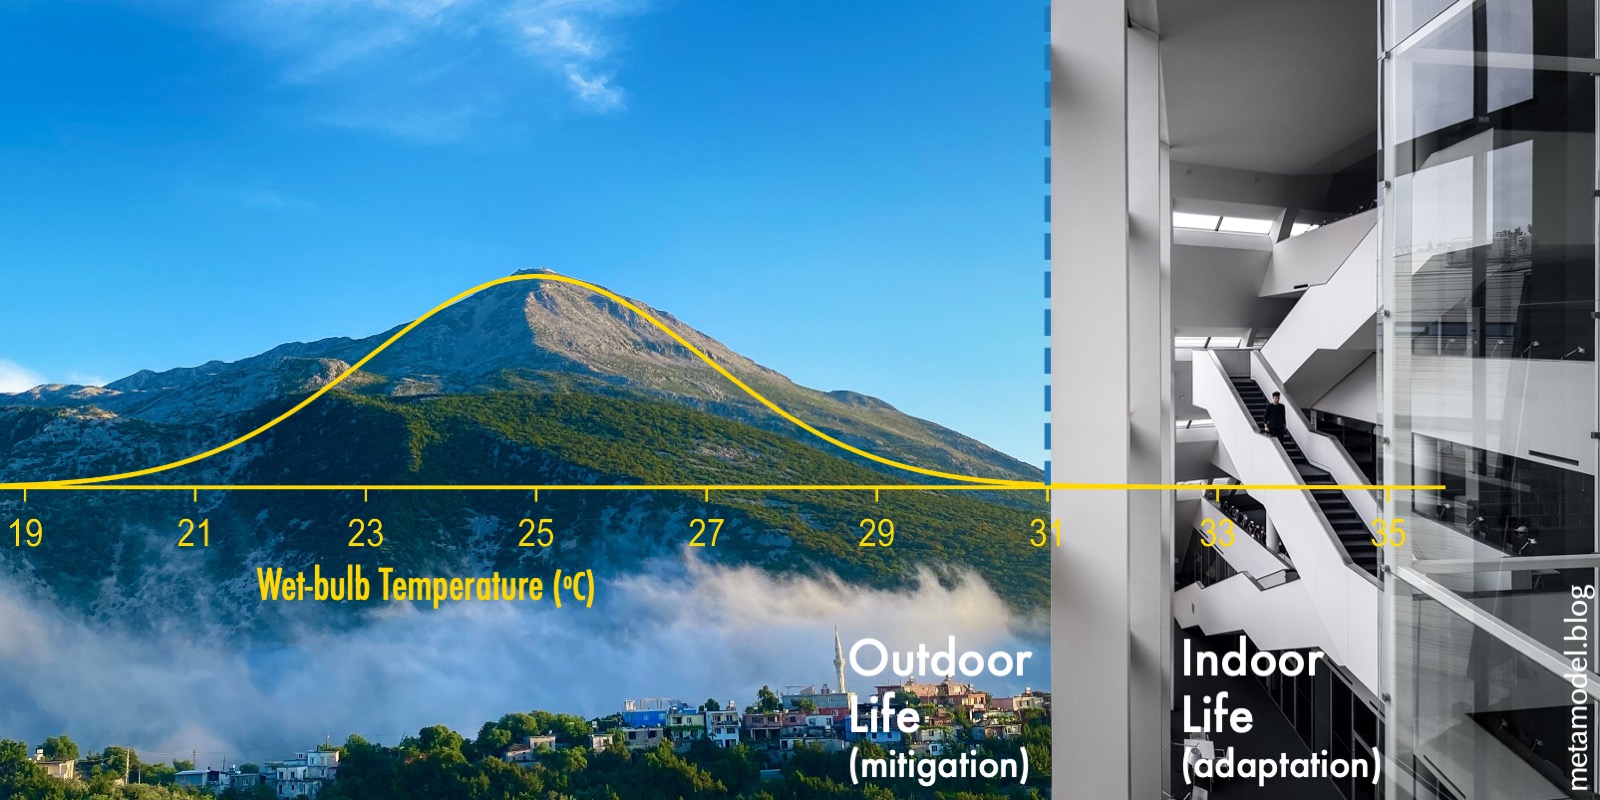
The wet-bulb temperature is a combined measure of heat and humidity that tells us whether we can continue to cool our bodies naturally. If the wet-bulb temperature exceeds a hard theoretical threshold of 35°C, it becomes impossible to do that. We cannot survive without air conditioning. There is also a softer practical threshold of about 31°C beyond which outdoor activities will need to be severely curtailed.7
We calculate the wet-bulb temperature using a formula that takes surface temperature and relative humidity as inputs. Temperature and relative humidity vary throughout the day. Dew forms in the pre-dawn hours of the morning, when temperature is the lowest but relative humidity is the highest. As temperature increases during the day, the relative humidity typically falls. This anti-correlation between temperature and relative humidity affects wet-bulb temperature.
Fine print in the McKinsey report
The McKinsey report relies on predictions of how wet-bulb temperatures will change in the future for many of its headline findings. To calculate wet-bulb temperature accurately, we should ideally use hourly information of surface temperature and relative humidity. But such detailed hourly information is not always saved for model predictions of the future. Often, only the daily average or maximum/minimum values are available. As described in a footnote,8 the McKinsey report uses daily maximum temperature and daily average relative humidity to compute the wet-bulb temperature. The implicit assumption is that this procedure provides a good estimate of the daily maximum wet-bulb temperature.
We cannot check the procedure used by the McKinsey report simply by looking at the formula for wet-bulb temperature. The formula is so complicated and nonlinear that it is hard to figure out how variations in temperature and relative humidity affect the wet-bulb temperature. The strong nonlinearity means that inadvertent time averaging could potentially introduce large errors.
To check the procedure used in the report, we need to analyze data. We consider hourly variations in temperature and relative humidity during May 2002 at one location, New Delhi, India, which lies in our region of interest.
Figure 1 shows that temperature and relative humidity at New Delhi vary in an anti-correlated manner throughout the day. The wet-bulb temperature computed using hourly data varies between 19.4°C and 24.2°C. The straight line shows the wet-bulb temperature computed using the daily maximum temperature and daily average relative humidity. This has a value of 26.7°C, which is about 2.5°C higher than the maximum wet-bulb temperature computed from the hourly data.
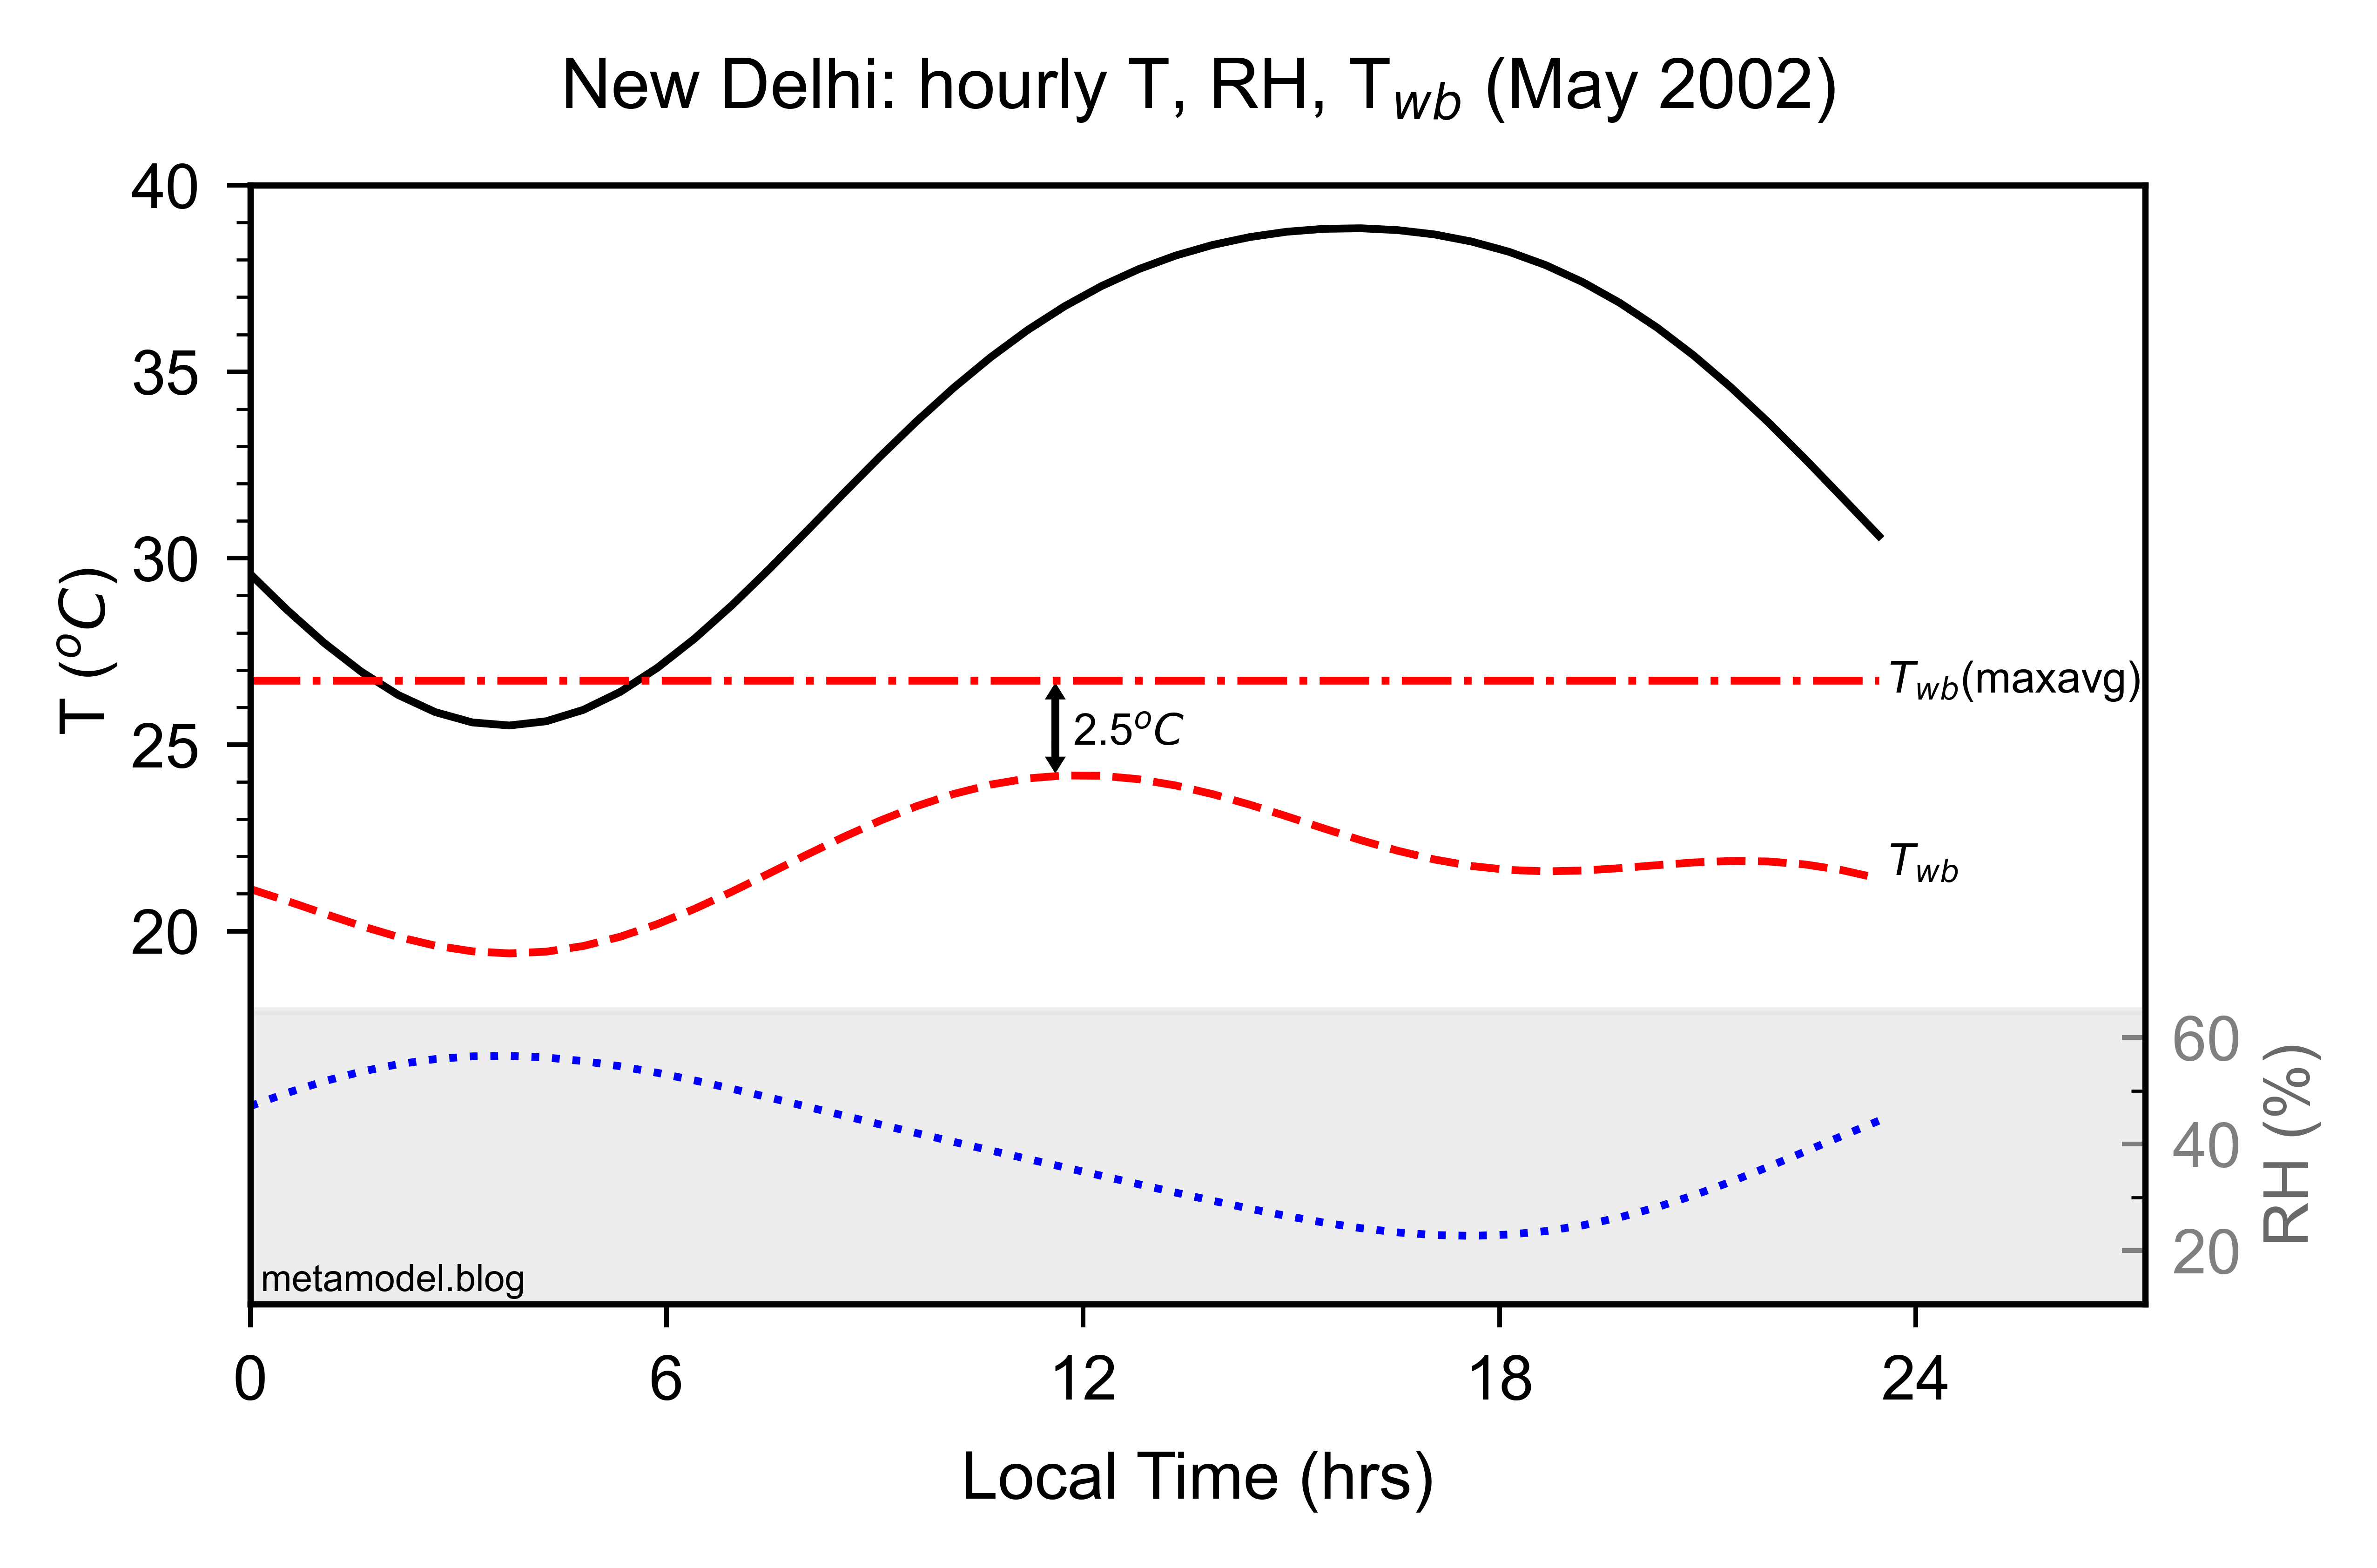
Figure 1. Hourly surface temperature (black solid) and Relative Humidity (blue dotted) for New Delhi (India) during May 2002. Wet-bulb temperature calculated from hourly data (red dashed).9 Wet-bulb temperature calculated using daily maximum temperature and daily average relative humidity (red dashdot). [Fourier-smoothed data obtained from Patel et al. 2002 10]
When we combine the maximum temperature with average relative humidity, we overestimate the wet-bulb temperature. To understand the implications of this, let us consider a hypothetical normal probability distribution of wet-bulb temperature for May in New Delhi, centered at 25°C. The standard deviation (σ) for daily maximum temperature in New Delhi is about 2.5°C.11 Let us assume that the standard deviation for daily maximum wet-bulb temperature is somewhat less, say 2.0°C.12 Then the probability distribution for wet-bulb temperature corresponds to distribution A in Figure 2. If we overestimate the daily wet-bulb temperature by 2.0°C, the distribution will shift to the right by one standard deviation or one-σ, forming distribution B in Figure 2.
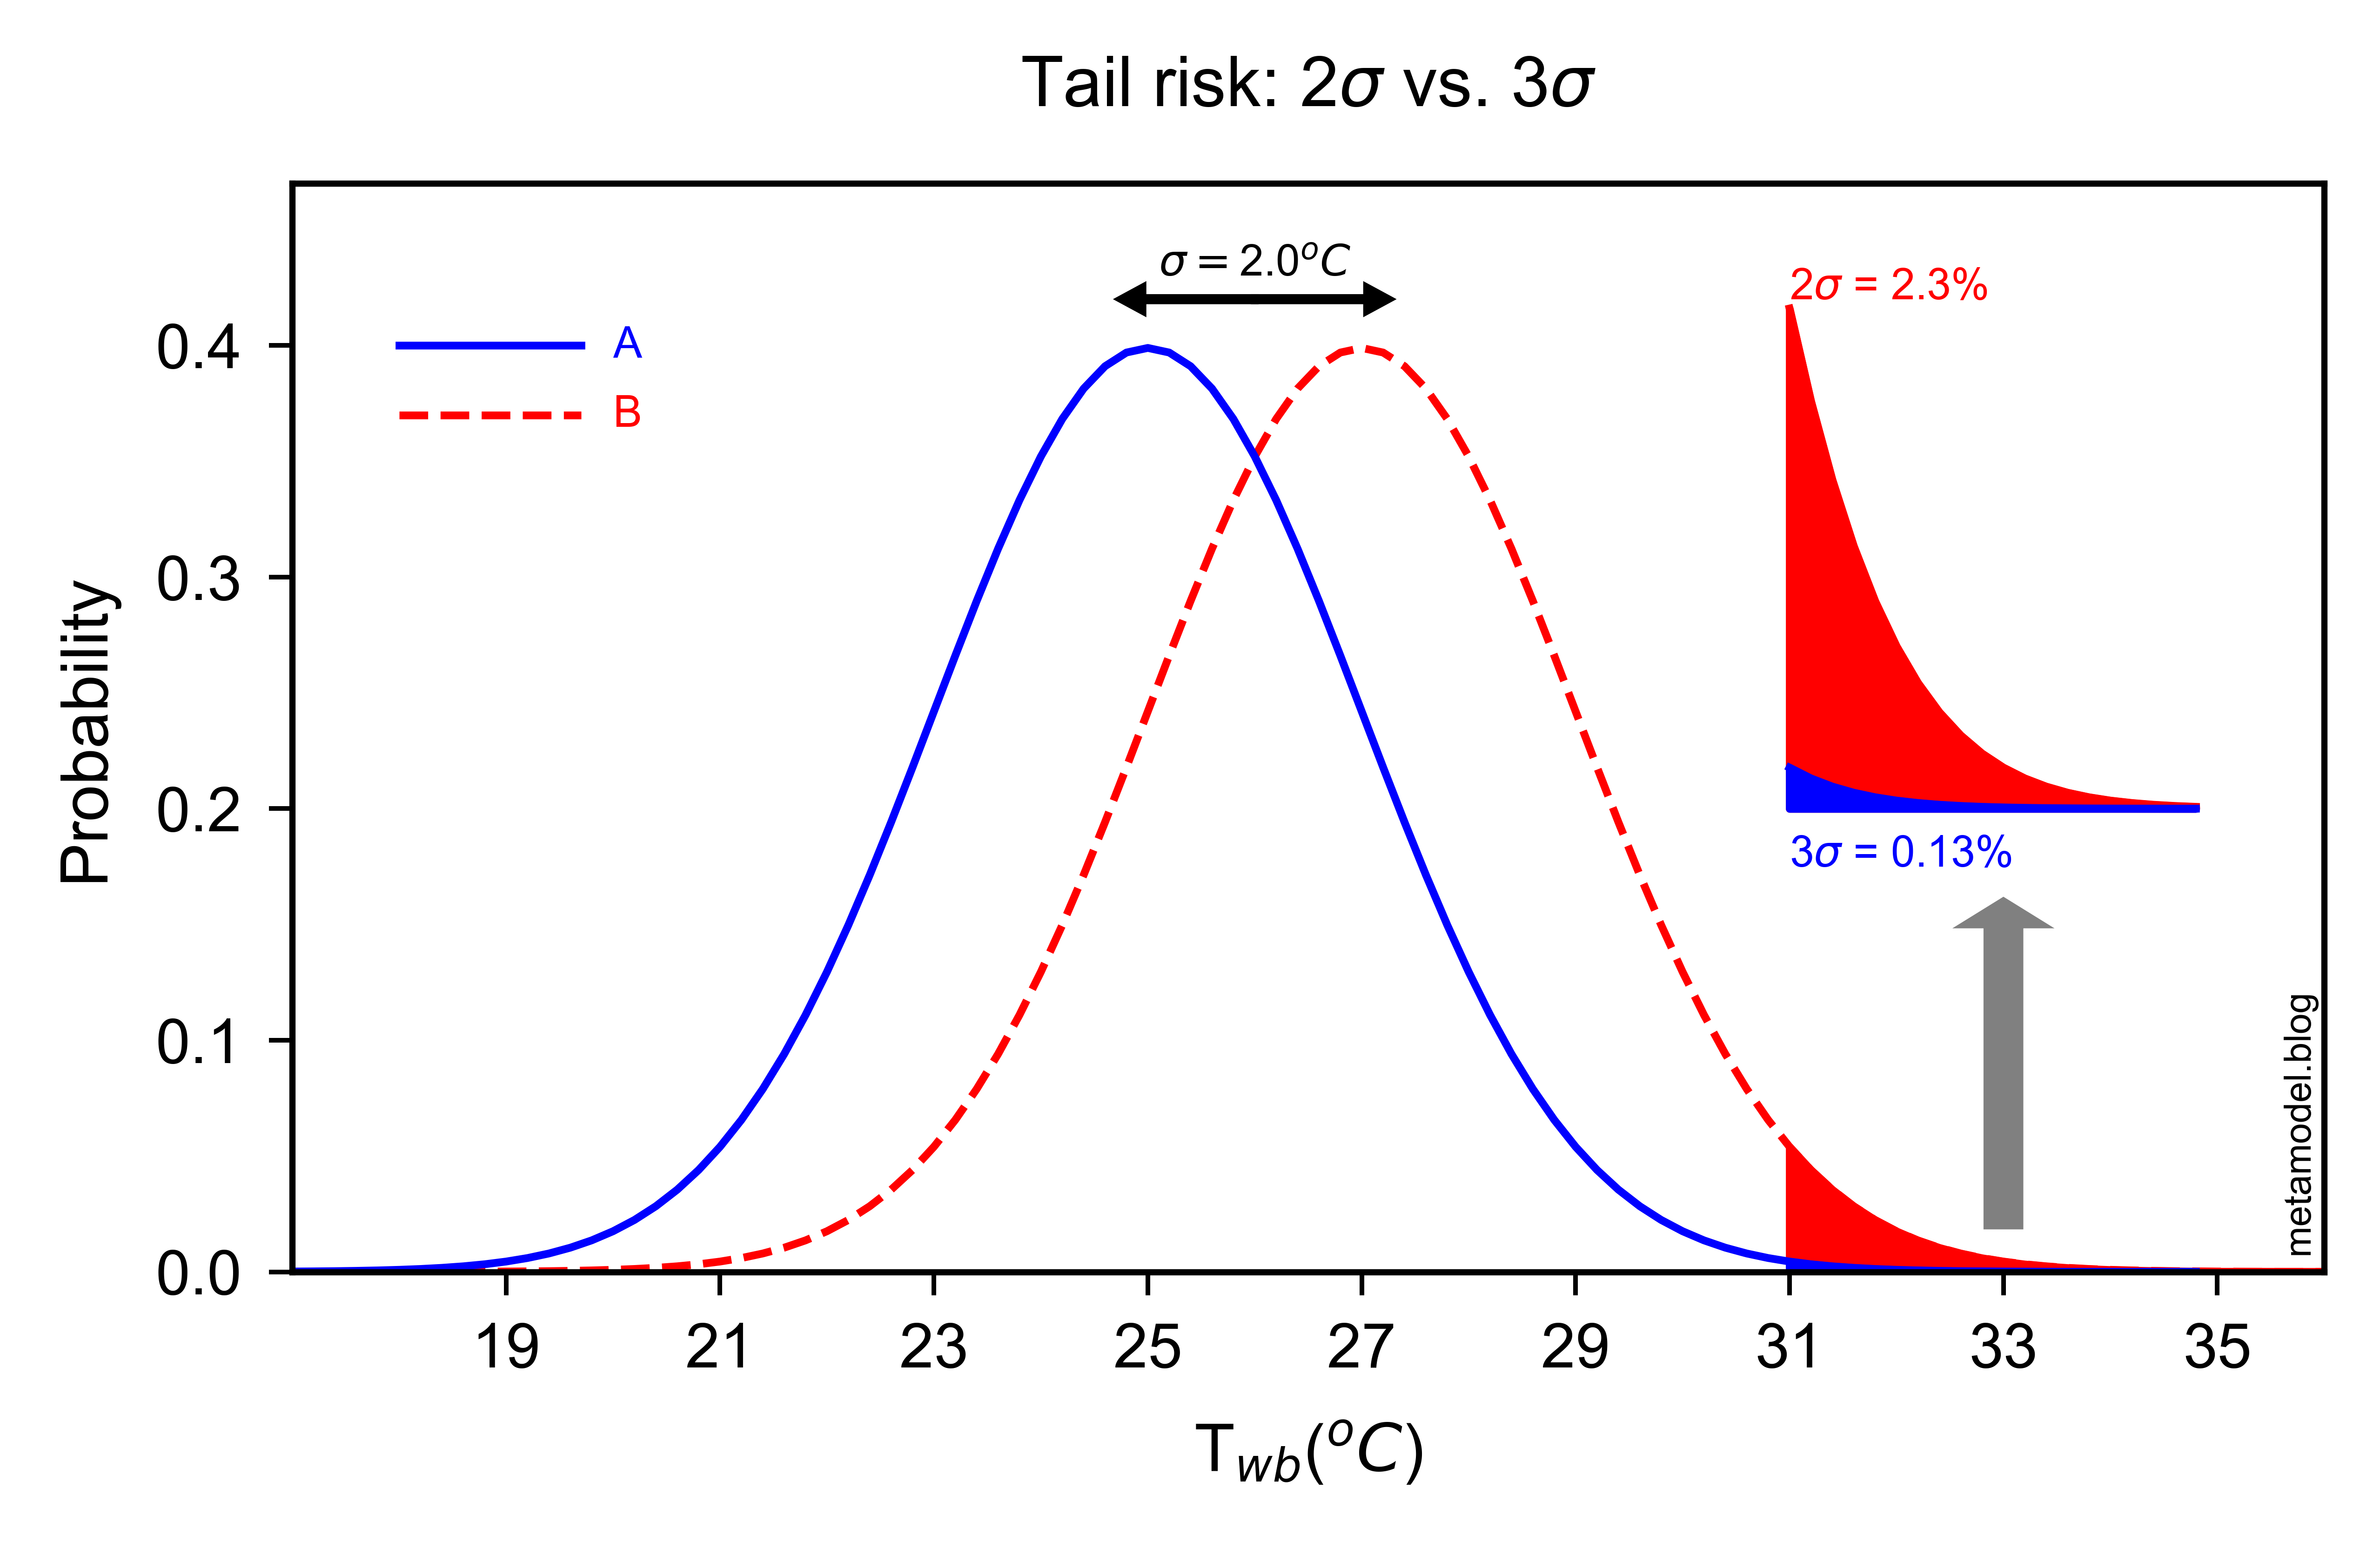
Figure 2. Assumed normal probability distribution of wet-bulb temperature with standard deviation of 2°C. A. Centered at 25 °C (blue). B. Centered at 27°C (red). Probabilities of wet-bulb temperature exceeding 31°C are shaded, and the shaded areas under the curve are shown as percentages.
Suppose we are interested in extreme values of the wet-bulb temperature, say exceeding a soft threshold of 31°C (the McKinsey report actually uses a more severe threshold of 34°C to define “lethal” heat waves.) For distribution A, the 31°C threshold is three-σ away from the mean of 25°C. This means that there is a 0.13% probability that the soft threshold will be exceeded. For distribution B, the 31°C threshold is only two-σ away from the mean of 27°C. This means that there is a 2.3% probability that the soft threshold will be exceeded.
As illustrated in Figure 2, a 2.0°C error in estimating the wet-bulb temperature can lead to a factor of 17(=2.3/0.13) error in estimating the probability of exceeding the 31°C threshold. Recall that using the average relative humidity resulted in an overestimation of the maximum wet-bulb temperature by 2.5°C. This 1.25σ error would overestimate the probability of exceeding the threshold by a factor of 39. If errors of this magnitude are present in the McKinsey report, then its conclusions will need to be revised. Whether or not that’s the case, this analysis serves as a cautionary tale in estimating the tail risk of climate change.
What do we learn from this analysis?
- Climate risk reports from consultants often contain precise sounding impact numbers and probability estimates. But these numbers may depend on various assumptions, not all of which may even be noted in the report. Reading the fine print and requesting any additional supporting information is a good idea. It is also worth carrying out simple back-of-the-envelope calculations to check the numbers using data at selected locations.
- Consultant reports that have not been thoroughly peer-reviewed by experts should be considered less authoritative than scientific reports like IPCC assessments that have undergone extensive peer review.
- In risk assessment, a modest error in the estimate of the average can alter tail risk probabilities by an order of magnitude. This is the flip-side of the argument made about the frequency of extreme events in a changing climate, that even a small increase in the average temperature can lead to a big change in the frequency of extreme heat waves.13
- The difficulty in quantifying the tail risk means that we should perhaps not take many numeric estimates of tail risk literally, even as we take the overall risk assessment itself seriously.
Climate change is a serious threat, and we don’t always need fancy computer models or voluminous consultant reports to help us appreciate that. Reinterpreting Figure 2, we can see that a 2.0°C rise in the average wet-bulb temperature will increase the probability of exceeding the 31°C threshold by a factor of 17. A 1°C rise, which is well within the realm of possibility based on current warming trends, will increase the probability of exceeding the threshold by a factor of 4.6, which still amounts to a large increase in risk.14
-
Heat and humidity are putting millions of Indians in peril (The Economist) ↩︎
-
Can Science Fiction Wake Us Up to Our Climate Reality? (New Yorker) ↩︎
-
Climate risk and response: Physical hazards and socioeconomic impacts (McKinsey Global Institute) ↩︎
-
The Climate Demon: Past, Present, and Future of Climate Prediction, p.3-4 (ClimateDemon.com) ↩︎
-
Patrick T. Brown tweet thread (Twitter) ↩︎
-
An adaptability limit to climate change due to heat stress (PNAS.org) ↩︎
-
Evaluating the 35°C wet-bulb temperature adaptability threshold for young, healthy subjects (PSU HEAT Project) (Physiology.org) ↩︎
-
Climate risk and response: Physical hazards and socioeconomic impacts, p.57, footnote. 101 (McKinsey Global Institute) ↩︎
-
Wet-bulb temperature was calculated using MetPy software, but with the Davies-Jones (2008) equation (3.4) for the final step. Using the MetPy-supplied formula for wet-bulb temperature yields slightly different results, but not enough to make a difference for our purposes. For a simple web-based tool to estimate wet-bulb temperature, you can try Omnicalculator use by The Economist article. The biggest source of error is not the choice of formula for wet-bulb temperature but the use of daily average relative humidity. ↩︎
-
Energy Aware Grid: Global Workload Placement Based on Energy Efficiency, C. Patel et al., 2002 (HP.com) ↩︎
-
Average High and Low Temperature in May in New Delhi (Weatherspark.com) ↩︎
-
Calculations with increased temperature but fixed relative humidity indicate that the wet-bulb temperature changes are smaller than the temperature changes by about 25%. ↩︎
-
An Introduction to Trends in Extreme Weather and Climate Events: Observations, Socioeconomic Impacts, Terrestrial Ecological Impacts, and Model Projections (AMetSoc.org) ↩︎
-
Don’t take these numbers literally, since they depend on some rather crude assumptions described earlier in this article. ↩︎